Serbian vs Dutch West Indian Median Household Income
COMPARE
Serbian
Dutch West Indian
Median Household Income
Median Household Income Comparison
Serbians
Dutch West Indians
$87,572
MEDIAN HOUSEHOLD INCOME
83.0/ 100
METRIC RATING
144th/ 347
METRIC RANK
$68,412
MEDIAN HOUSEHOLD INCOME
0.0/ 100
METRIC RATING
329th/ 347
METRIC RANK
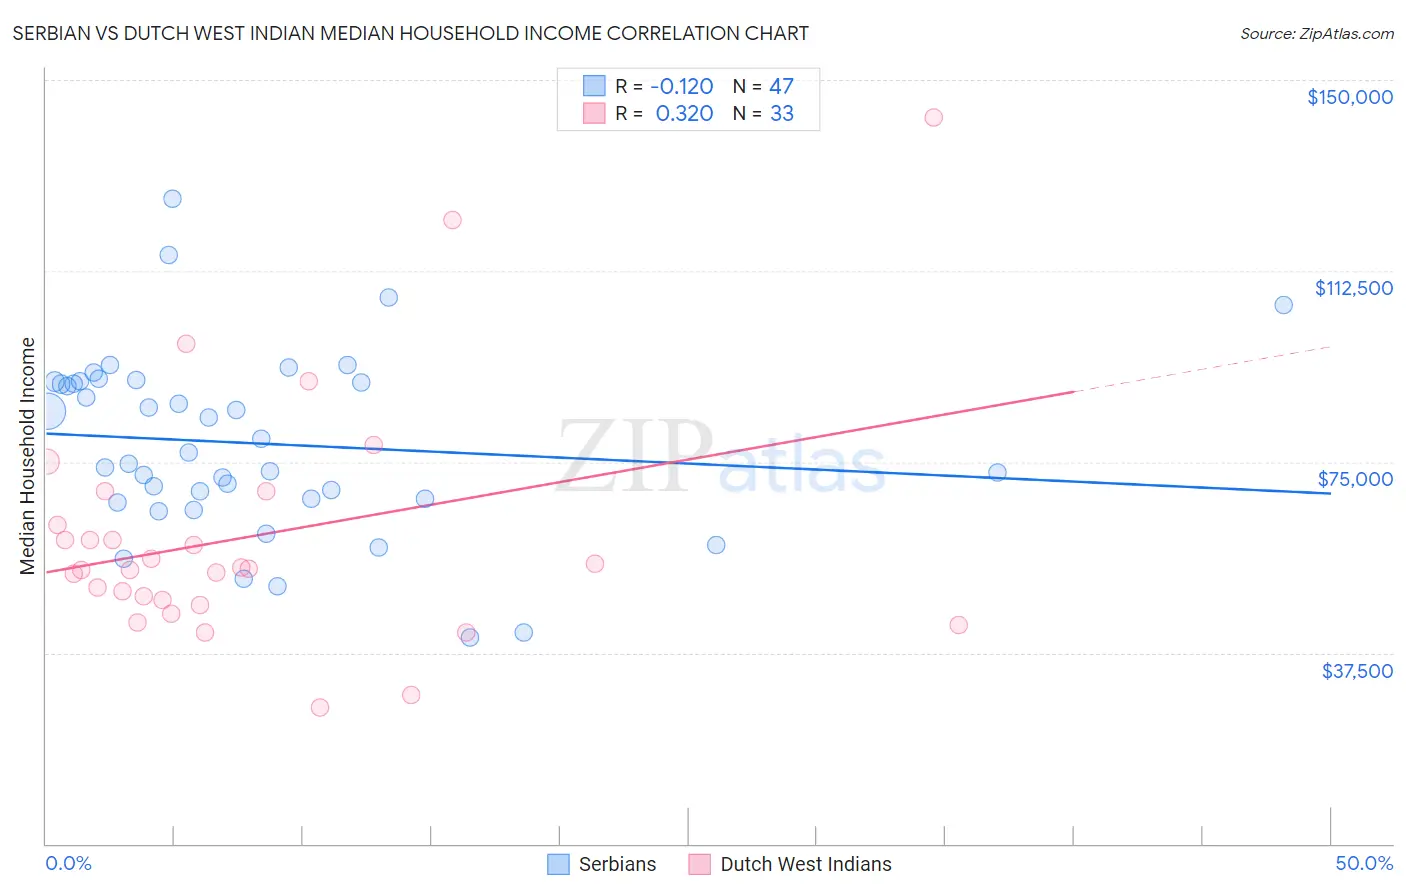
Serbian vs Dutch West Indian Median Household Income Correlation Chart
The statistical analysis conducted on geographies consisting of 267,501,646 people shows a poor negative correlation between the proportion of Serbians and median household income in the United States with a correlation coefficient (R) of -0.120 and weighted average of $87,572. Similarly, the statistical analysis conducted on geographies consisting of 85,760,396 people shows a mild positive correlation between the proportion of Dutch West Indians and median household income in the United States with a correlation coefficient (R) of 0.320 and weighted average of $68,412, a difference of 28.0%.
Median Household Income Correlation Summary
| Measurement | Serbian | Dutch West Indian |
| Minimum | $40,500 | $26,875 |
| Maximum | $126,567 | $142,750 |
| Range | $86,067 | $115,875 |
| Mean | $78,611 | $60,408 |
| Median | $76,777 | $53,986 |
| Interquartile 25% (IQ1) | $67,750 | $47,365 |
| Interquartile 75% (IQ3) | $90,729 | $65,865 |
| Interquartile Range (IQR) | $22,979 | $18,501 |
| Standard Deviation (Sample) | $17,894 | $23,943 |
| Standard Deviation (Population) | $17,703 | $23,577 |
Similar Demographics by Median Household Income
Demographics Similar to Serbians by Median Household Income
In terms of median household income, the demographic groups most similar to Serbians are Ugandan ($87,557, a difference of 0.020%), Immigrants from Uganda ($87,553, a difference of 0.020%), Danish ($87,676, a difference of 0.12%), South American Indian ($87,446, a difference of 0.14%), and Canadian ($87,769, a difference of 0.22%).
| Demographics | Rating | Rank | Median Household Income |
| Sierra Leoneans | 89.6 /100 | #137 | Excellent $88,463 |
| Arabs | 89.2 /100 | #138 | Excellent $88,398 |
| Immigrants | Chile | 89.2 /100 | #139 | Excellent $88,388 |
| Lebanese | 87.2 /100 | #140 | Excellent $88,091 |
| Immigrants | Morocco | 86.0 /100 | #141 | Excellent $87,930 |
| Canadians | 84.7 /100 | #142 | Excellent $87,769 |
| Danes | 83.9 /100 | #143 | Excellent $87,676 |
| Serbians | 83.0 /100 | #144 | Excellent $87,572 |
| Ugandans | 82.9 /100 | #145 | Excellent $87,557 |
| Immigrants | Uganda | 82.8 /100 | #146 | Excellent $87,553 |
| South American Indians | 81.8 /100 | #147 | Excellent $87,446 |
| Costa Ricans | 80.0 /100 | #148 | Excellent $87,262 |
| Immigrants | Nepal | 77.7 /100 | #149 | Good $87,046 |
| Basques | 77.2 /100 | #150 | Good $87,001 |
| Hungarians | 76.3 /100 | #151 | Good $86,920 |
Demographics Similar to Dutch West Indians by Median Household Income
In terms of median household income, the demographic groups most similar to Dutch West Indians are Menominee ($68,423, a difference of 0.020%), Immigrants from Cuba ($68,461, a difference of 0.070%), Yuman ($68,743, a difference of 0.48%), Arapaho ($67,965, a difference of 0.66%), and Native/Alaskan ($67,879, a difference of 0.79%).
| Demographics | Rating | Rank | Median Household Income |
| Choctaw | 0.0 /100 | #322 | Tragic $69,947 |
| Bahamians | 0.0 /100 | #323 | Tragic $69,726 |
| Yup'ik | 0.0 /100 | #324 | Tragic $69,695 |
| Seminole | 0.0 /100 | #325 | Tragic $69,420 |
| Yuman | 0.0 /100 | #326 | Tragic $68,743 |
| Immigrants | Cuba | 0.0 /100 | #327 | Tragic $68,461 |
| Menominee | 0.0 /100 | #328 | Tragic $68,423 |
| Dutch West Indians | 0.0 /100 | #329 | Tragic $68,412 |
| Arapaho | 0.0 /100 | #330 | Tragic $67,965 |
| Natives/Alaskans | 0.0 /100 | #331 | Tragic $67,879 |
| Sioux | 0.0 /100 | #332 | Tragic $67,792 |
| Creek | 0.0 /100 | #333 | Tragic $67,715 |
| Blacks/African Americans | 0.0 /100 | #334 | Tragic $67,573 |
| Cheyenne | 0.0 /100 | #335 | Tragic $66,974 |
| Immigrants | Congo | 0.0 /100 | #336 | Tragic $66,768 |