Serbian vs Ukrainian Median Household Income
COMPARE
Serbian
Ukrainian
Median Household Income
Median Household Income Comparison
Serbians
Ukrainians
$87,572
MEDIAN HOUSEHOLD INCOME
83.0/ 100
METRIC RATING
144th/ 347
METRIC RANK
$91,456
MEDIAN HOUSEHOLD INCOME
98.3/ 100
METRIC RATING
100th/ 347
METRIC RANK
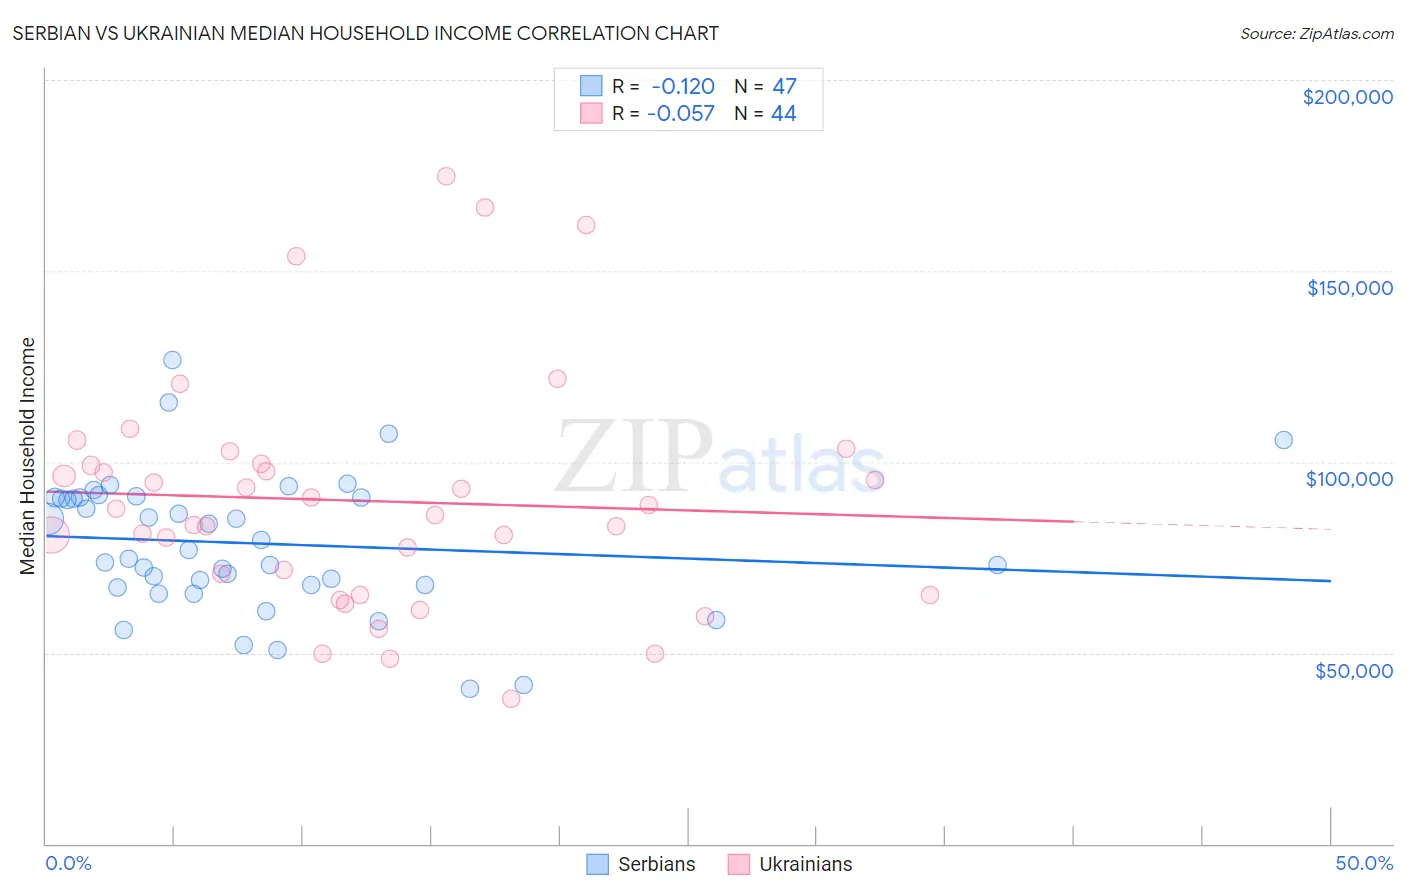
Serbian vs Ukrainian Median Household Income Correlation Chart
The statistical analysis conducted on geographies consisting of 267,501,646 people shows a poor negative correlation between the proportion of Serbians and median household income in the United States with a correlation coefficient (R) of -0.120 and weighted average of $87,572. Similarly, the statistical analysis conducted on geographies consisting of 448,198,646 people shows a slight negative correlation between the proportion of Ukrainians and median household income in the United States with a correlation coefficient (R) of -0.057 and weighted average of $91,456, a difference of 4.4%.
Median Household Income Correlation Summary
| Measurement | Serbian | Ukrainian |
| Minimum | $40,500 | $37,811 |
| Maximum | $126,567 | $174,670 |
| Range | $86,067 | $136,859 |
| Mean | $78,611 | $89,793 |
| Median | $76,777 | $86,791 |
| Interquartile 25% (IQ1) | $67,750 | $67,812 |
| Interquartile 75% (IQ3) | $90,729 | $99,299 |
| Interquartile Range (IQR) | $22,979 | $31,486 |
| Standard Deviation (Sample) | $17,894 | $30,572 |
| Standard Deviation (Population) | $17,703 | $30,223 |
Similar Demographics by Median Household Income
Demographics Similar to Serbians by Median Household Income
In terms of median household income, the demographic groups most similar to Serbians are Ugandan ($87,557, a difference of 0.020%), Immigrants from Uganda ($87,553, a difference of 0.020%), Danish ($87,676, a difference of 0.12%), South American Indian ($87,446, a difference of 0.14%), and Canadian ($87,769, a difference of 0.22%).
| Demographics | Rating | Rank | Median Household Income |
| Sierra Leoneans | 89.6 /100 | #137 | Excellent $88,463 |
| Arabs | 89.2 /100 | #138 | Excellent $88,398 |
| Immigrants | Chile | 89.2 /100 | #139 | Excellent $88,388 |
| Lebanese | 87.2 /100 | #140 | Excellent $88,091 |
| Immigrants | Morocco | 86.0 /100 | #141 | Excellent $87,930 |
| Canadians | 84.7 /100 | #142 | Excellent $87,769 |
| Danes | 83.9 /100 | #143 | Excellent $87,676 |
| Serbians | 83.0 /100 | #144 | Excellent $87,572 |
| Ugandans | 82.9 /100 | #145 | Excellent $87,557 |
| Immigrants | Uganda | 82.8 /100 | #146 | Excellent $87,553 |
| South American Indians | 81.8 /100 | #147 | Excellent $87,446 |
| Costa Ricans | 80.0 /100 | #148 | Excellent $87,262 |
| Immigrants | Nepal | 77.7 /100 | #149 | Good $87,046 |
| Basques | 77.2 /100 | #150 | Good $87,001 |
| Hungarians | 76.3 /100 | #151 | Good $86,920 |
Demographics Similar to Ukrainians by Median Household Income
In terms of median household income, the demographic groups most similar to Ukrainians are Immigrants from Moldova ($91,446, a difference of 0.010%), Immigrants from South Eastern Asia ($91,541, a difference of 0.090%), Austrian ($91,339, a difference of 0.13%), Immigrants from Southern Europe ($91,605, a difference of 0.16%), and Immigrants from Serbia ($91,730, a difference of 0.30%).
| Demographics | Rating | Rank | Median Household Income |
| Immigrants | Lebanon | 98.7 /100 | #93 | Exceptional $91,887 |
| Immigrants | North America | 98.7 /100 | #94 | Exceptional $91,860 |
| Armenians | 98.7 /100 | #95 | Exceptional $91,807 |
| Jordanians | 98.7 /100 | #96 | Exceptional $91,794 |
| Immigrants | Serbia | 98.6 /100 | #97 | Exceptional $91,730 |
| Immigrants | Southern Europe | 98.5 /100 | #98 | Exceptional $91,605 |
| Immigrants | South Eastern Asia | 98.4 /100 | #99 | Exceptional $91,541 |
| Ukrainians | 98.3 /100 | #100 | Exceptional $91,456 |
| Immigrants | Moldova | 98.3 /100 | #101 | Exceptional $91,446 |
| Austrians | 98.2 /100 | #102 | Exceptional $91,339 |
| Immigrants | Ukraine | 98.0 /100 | #103 | Exceptional $91,124 |
| Immigrants | Kazakhstan | 97.8 /100 | #104 | Exceptional $91,015 |
| Immigrants | Brazil | 97.7 /100 | #105 | Exceptional $90,907 |
| Macedonians | 97.4 /100 | #106 | Exceptional $90,761 |
| Croatians | 97.3 /100 | #107 | Exceptional $90,685 |