Senegalese vs Immigrants from Caribbean Householder Income Ages 25 - 44 years
COMPARE
Senegalese
Immigrants from Caribbean
Householder Income Ages 25 - 44 years
Householder Income Ages 25 - 44 years Comparison
Senegalese
Immigrants from Caribbean
$82,852
HOUSEHOLDER INCOME AGES 25 - 44 YEARS
0.2/ 100
METRIC RATING
278th/ 347
METRIC RANK
$80,326
HOUSEHOLDER INCOME AGES 25 - 44 YEARS
0.0/ 100
METRIC RATING
304th/ 347
METRIC RANK
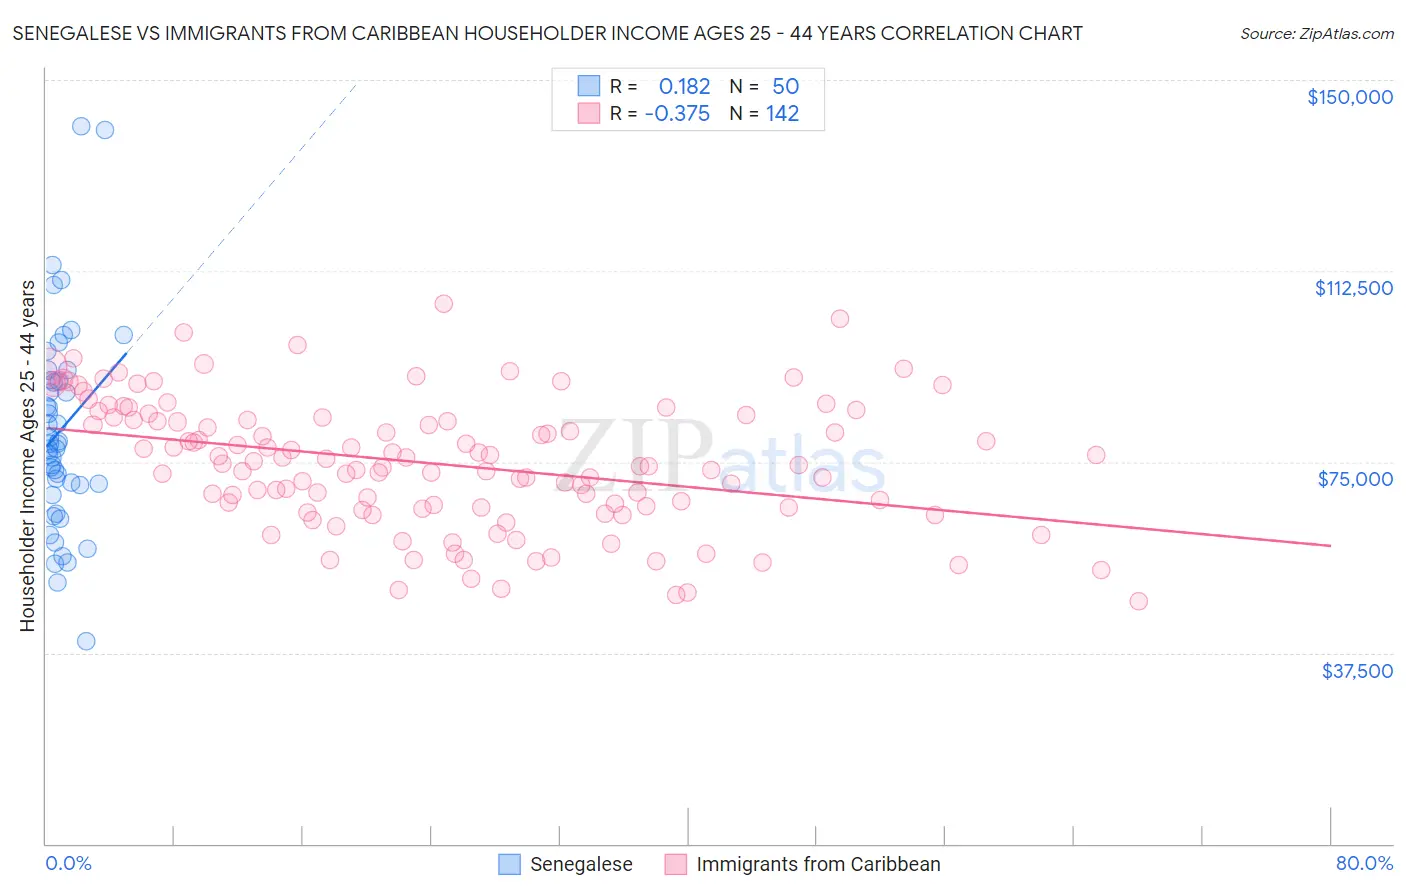
Senegalese vs Immigrants from Caribbean Householder Income Ages 25 - 44 years Correlation Chart
The statistical analysis conducted on geographies consisting of 78,048,769 people shows a poor positive correlation between the proportion of Senegalese and household income with householder between the ages 25 and 44 in the United States with a correlation coefficient (R) of 0.182 and weighted average of $82,852. Similarly, the statistical analysis conducted on geographies consisting of 448,247,507 people shows a mild negative correlation between the proportion of Immigrants from Caribbean and household income with householder between the ages 25 and 44 in the United States with a correlation coefficient (R) of -0.375 and weighted average of $80,326, a difference of 3.1%.
Householder Income Ages 25 - 44 years Correlation Summary
| Measurement | Senegalese | Immigrants from Caribbean |
| Minimum | $39,688 | $47,510 |
| Maximum | $141,023 | $105,938 |
| Range | $101,335 | $58,428 |
| Mean | $81,327 | $74,665 |
| Median | $78,521 | $74,621 |
| Interquartile 25% (IQ1) | $70,437 | $66,150 |
| Interquartile 75% (IQ3) | $90,994 | $83,625 |
| Interquartile Range (IQR) | $20,557 | $17,475 |
| Standard Deviation (Sample) | $20,178 | $12,546 |
| Standard Deviation (Population) | $19,975 | $12,502 |
Similar Demographics by Householder Income Ages 25 - 44 years
Demographics Similar to Senegalese by Householder Income Ages 25 - 44 years
In terms of householder income ages 25 - 44 years, the demographic groups most similar to Senegalese are Pima ($82,821, a difference of 0.040%), Paiute ($82,984, a difference of 0.16%), Colville ($82,604, a difference of 0.30%), Immigrants from Belize ($83,141, a difference of 0.35%), and Immigrants from Jamaica ($83,298, a difference of 0.54%).
| Demographics | Rating | Rank | Householder Income Ages 25 - 44 years |
| Somalis | 0.2 /100 | #271 | Tragic $83,752 |
| Spanish Americans | 0.2 /100 | #272 | Tragic $83,722 |
| Iroquois | 0.2 /100 | #273 | Tragic $83,682 |
| Marshallese | 0.2 /100 | #274 | Tragic $83,575 |
| Immigrants | Jamaica | 0.2 /100 | #275 | Tragic $83,298 |
| Immigrants | Belize | 0.2 /100 | #276 | Tragic $83,141 |
| Paiute | 0.2 /100 | #277 | Tragic $82,984 |
| Senegalese | 0.2 /100 | #278 | Tragic $82,852 |
| Pima | 0.1 /100 | #279 | Tragic $82,821 |
| Colville | 0.1 /100 | #280 | Tragic $82,604 |
| Cajuns | 0.1 /100 | #281 | Tragic $82,393 |
| Central American Indians | 0.1 /100 | #282 | Tragic $82,355 |
| Guatemalans | 0.1 /100 | #283 | Tragic $82,331 |
| Immigrants | Middle Africa | 0.1 /100 | #284 | Tragic $82,254 |
| Immigrants | Somalia | 0.1 /100 | #285 | Tragic $82,188 |
Demographics Similar to Immigrants from Caribbean by Householder Income Ages 25 - 44 years
In terms of householder income ages 25 - 44 years, the demographic groups most similar to Immigrants from Caribbean are Immigrants from Dominican Republic ($80,319, a difference of 0.010%), Apache ($80,260, a difference of 0.080%), Mexican ($80,427, a difference of 0.13%), Hispanic or Latino ($80,515, a difference of 0.24%), and Immigrants from Micronesia ($80,544, a difference of 0.27%).
| Demographics | Rating | Rank | Householder Income Ages 25 - 44 years |
| Immigrants | Guatemala | 0.1 /100 | #297 | Tragic $81,341 |
| Dominicans | 0.1 /100 | #298 | Tragic $81,229 |
| Immigrants | Liberia | 0.1 /100 | #299 | Tragic $80,863 |
| Cherokee | 0.0 /100 | #300 | Tragic $80,843 |
| Immigrants | Micronesia | 0.0 /100 | #301 | Tragic $80,544 |
| Hispanics or Latinos | 0.0 /100 | #302 | Tragic $80,515 |
| Mexicans | 0.0 /100 | #303 | Tragic $80,427 |
| Immigrants | Caribbean | 0.0 /100 | #304 | Tragic $80,326 |
| Immigrants | Dominican Republic | 0.0 /100 | #305 | Tragic $80,319 |
| Apache | 0.0 /100 | #306 | Tragic $80,260 |
| Haitians | 0.0 /100 | #307 | Tragic $80,055 |
| Immigrants | Central America | 0.0 /100 | #308 | Tragic $80,012 |
| Chippewa | 0.0 /100 | #309 | Tragic $80,005 |
| Fijians | 0.0 /100 | #310 | Tragic $79,956 |
| Indonesians | 0.0 /100 | #311 | Tragic $79,543 |