Senegalese vs Nicaraguan Householder Income Ages 25 - 44 years
COMPARE
Senegalese
Nicaraguan
Householder Income Ages 25 - 44 years
Householder Income Ages 25 - 44 years Comparison
Senegalese
Nicaraguans
$82,852
HOUSEHOLDER INCOME AGES 25 - 44 YEARS
0.2/ 100
METRIC RATING
278th/ 347
METRIC RANK
$87,751
HOUSEHOLDER INCOME AGES 25 - 44 YEARS
2.2/ 100
METRIC RATING
240th/ 347
METRIC RANK
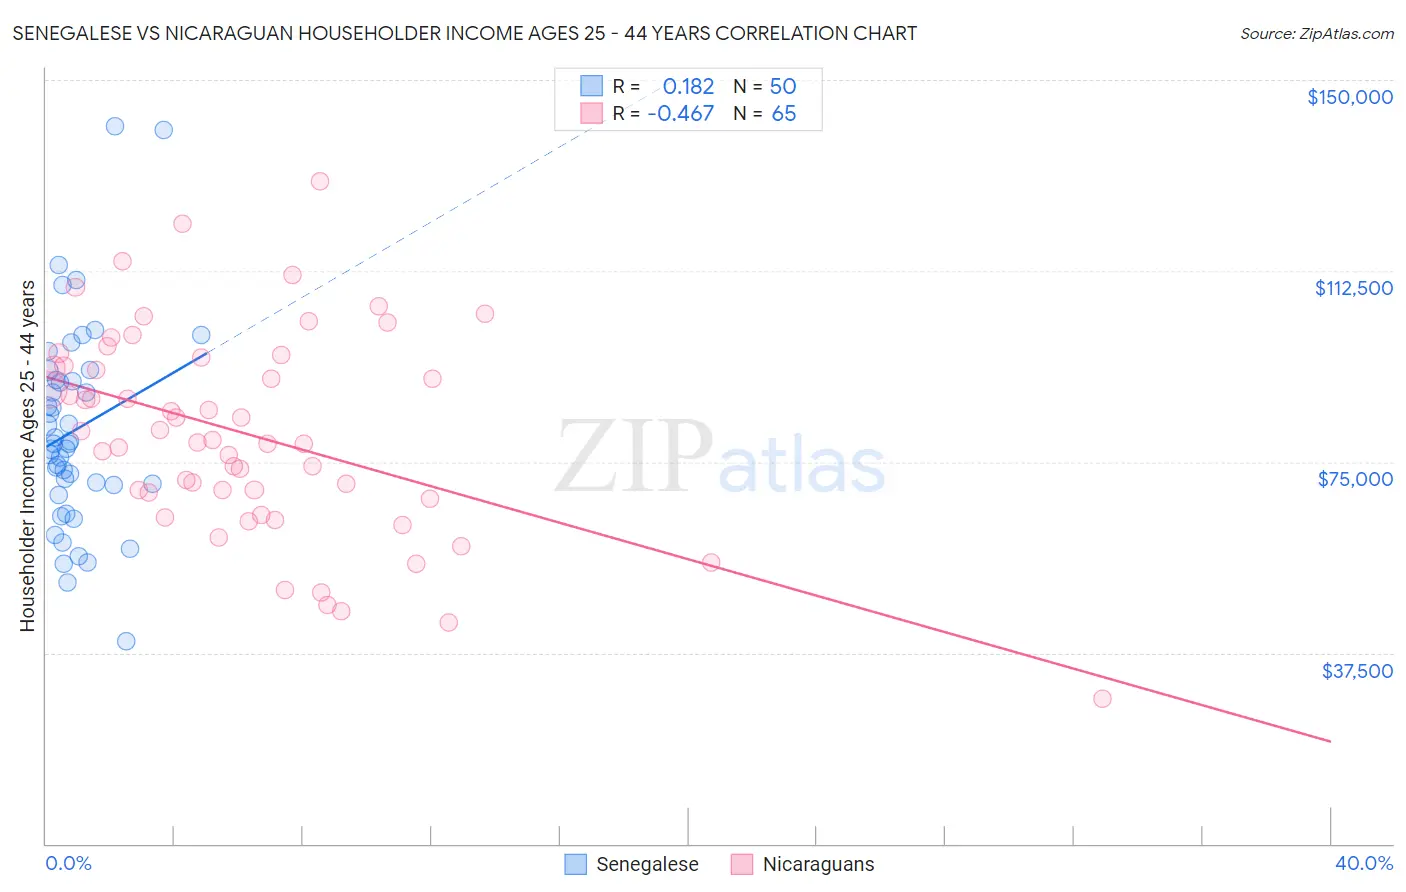
Senegalese vs Nicaraguan Householder Income Ages 25 - 44 years Correlation Chart
The statistical analysis conducted on geographies consisting of 78,048,769 people shows a poor positive correlation between the proportion of Senegalese and household income with householder between the ages 25 and 44 in the United States with a correlation coefficient (R) of 0.182 and weighted average of $82,852. Similarly, the statistical analysis conducted on geographies consisting of 285,307,176 people shows a moderate negative correlation between the proportion of Nicaraguans and household income with householder between the ages 25 and 44 in the United States with a correlation coefficient (R) of -0.467 and weighted average of $87,751, a difference of 5.9%.
Householder Income Ages 25 - 44 years Correlation Summary
| Measurement | Senegalese | Nicaraguan |
| Minimum | $39,688 | $28,500 |
| Maximum | $141,023 | $130,179 |
| Range | $101,335 | $101,679 |
| Mean | $81,327 | $80,440 |
| Median | $78,521 | $79,185 |
| Interquartile 25% (IQ1) | $70,437 | $68,448 |
| Interquartile 75% (IQ3) | $90,994 | $94,672 |
| Interquartile Range (IQR) | $20,557 | $26,224 |
| Standard Deviation (Sample) | $20,178 | $20,031 |
| Standard Deviation (Population) | $19,975 | $19,876 |
Similar Demographics by Householder Income Ages 25 - 44 years
Demographics Similar to Senegalese by Householder Income Ages 25 - 44 years
In terms of householder income ages 25 - 44 years, the demographic groups most similar to Senegalese are Pima ($82,821, a difference of 0.040%), Paiute ($82,984, a difference of 0.16%), Colville ($82,604, a difference of 0.30%), Immigrants from Belize ($83,141, a difference of 0.35%), and Immigrants from Jamaica ($83,298, a difference of 0.54%).
| Demographics | Rating | Rank | Householder Income Ages 25 - 44 years |
| Somalis | 0.2 /100 | #271 | Tragic $83,752 |
| Spanish Americans | 0.2 /100 | #272 | Tragic $83,722 |
| Iroquois | 0.2 /100 | #273 | Tragic $83,682 |
| Marshallese | 0.2 /100 | #274 | Tragic $83,575 |
| Immigrants | Jamaica | 0.2 /100 | #275 | Tragic $83,298 |
| Immigrants | Belize | 0.2 /100 | #276 | Tragic $83,141 |
| Paiute | 0.2 /100 | #277 | Tragic $82,984 |
| Senegalese | 0.2 /100 | #278 | Tragic $82,852 |
| Pima | 0.1 /100 | #279 | Tragic $82,821 |
| Colville | 0.1 /100 | #280 | Tragic $82,604 |
| Cajuns | 0.1 /100 | #281 | Tragic $82,393 |
| Central American Indians | 0.1 /100 | #282 | Tragic $82,355 |
| Guatemalans | 0.1 /100 | #283 | Tragic $82,331 |
| Immigrants | Middle Africa | 0.1 /100 | #284 | Tragic $82,254 |
| Immigrants | Somalia | 0.1 /100 | #285 | Tragic $82,188 |
Demographics Similar to Nicaraguans by Householder Income Ages 25 - 44 years
In terms of householder income ages 25 - 44 years, the demographic groups most similar to Nicaraguans are Immigrants from Ghana ($87,760, a difference of 0.010%), Nigerian ($87,730, a difference of 0.020%), Alaska Native ($88,018, a difference of 0.30%), Salvadoran ($88,198, a difference of 0.51%), and Immigrants from Cameroon ($88,214, a difference of 0.53%).
| Demographics | Rating | Rank | Householder Income Ages 25 - 44 years |
| Malaysians | 3.0 /100 | #233 | Tragic $88,291 |
| Venezuelans | 2.9 /100 | #234 | Tragic $88,232 |
| Bermudans | 2.9 /100 | #235 | Tragic $88,231 |
| Immigrants | Cameroon | 2.9 /100 | #236 | Tragic $88,214 |
| Salvadorans | 2.8 /100 | #237 | Tragic $88,198 |
| Alaska Natives | 2.6 /100 | #238 | Tragic $88,018 |
| Immigrants | Ghana | 2.2 /100 | #239 | Tragic $87,760 |
| Nicaraguans | 2.2 /100 | #240 | Tragic $87,751 |
| Nigerians | 2.2 /100 | #241 | Tragic $87,730 |
| West Indians | 1.7 /100 | #242 | Tragic $87,205 |
| Immigrants | West Indies | 1.5 /100 | #243 | Tragic $87,063 |
| Immigrants | Venezuela | 1.5 /100 | #244 | Tragic $87,038 |
| Immigrants | El Salvador | 1.4 /100 | #245 | Tragic $86,913 |
| Immigrants | Burma/Myanmar | 1.3 /100 | #246 | Tragic $86,736 |
| Immigrants | Nigeria | 1.2 /100 | #247 | Tragic $86,589 |