Senegalese vs Yaqui Householder Income Ages 25 - 44 years
COMPARE
Senegalese
Yaqui
Householder Income Ages 25 - 44 years
Householder Income Ages 25 - 44 years Comparison
Senegalese
Yaqui
$82,852
HOUSEHOLDER INCOME AGES 25 - 44 YEARS
0.2/ 100
METRIC RATING
278th/ 347
METRIC RANK
$81,656
HOUSEHOLDER INCOME AGES 25 - 44 YEARS
0.1/ 100
METRIC RATING
292nd/ 347
METRIC RANK
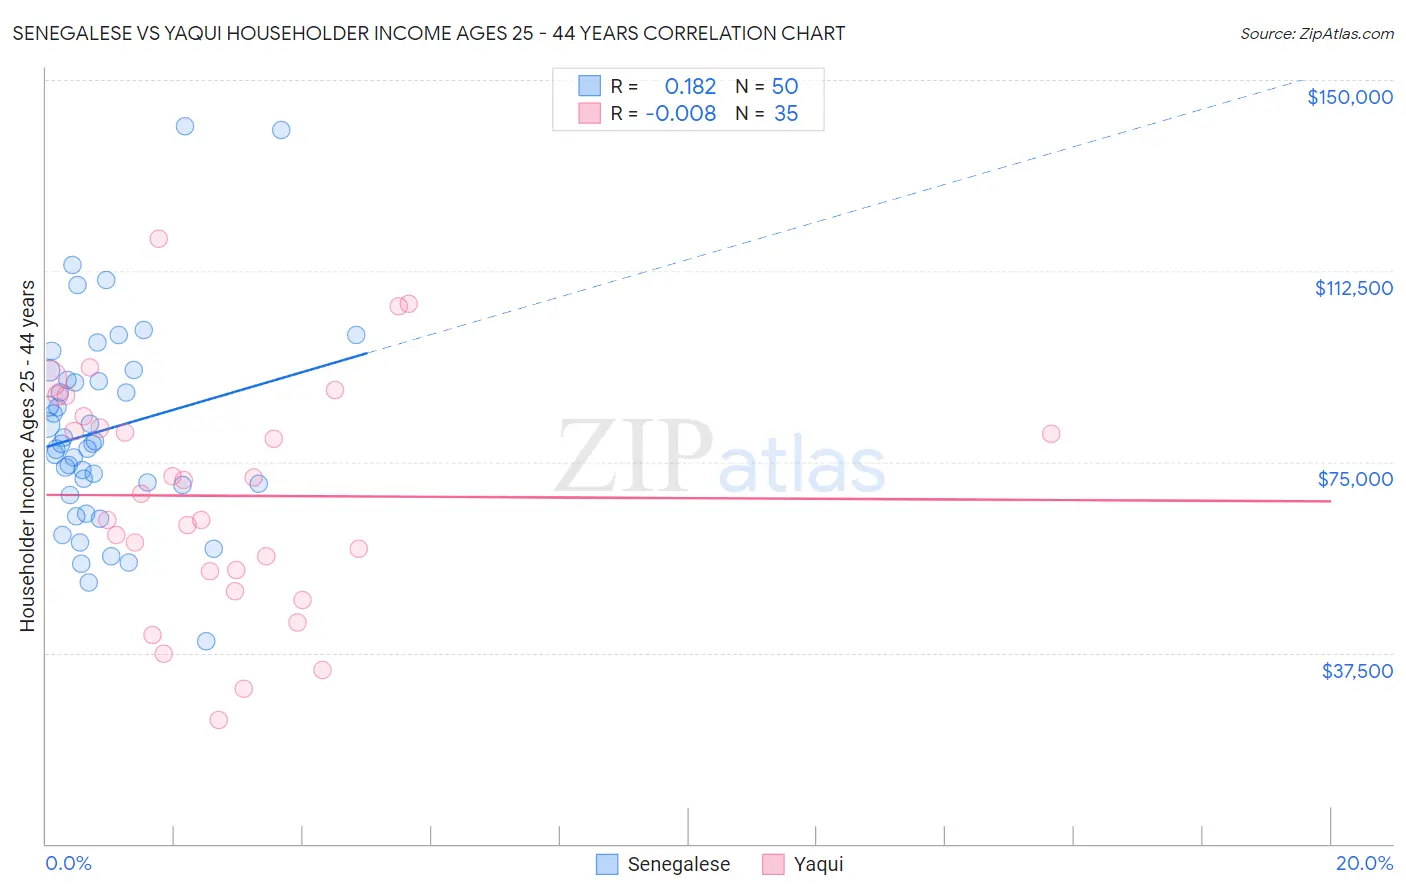
Senegalese vs Yaqui Householder Income Ages 25 - 44 years Correlation Chart
The statistical analysis conducted on geographies consisting of 78,048,769 people shows a poor positive correlation between the proportion of Senegalese and household income with householder between the ages 25 and 44 in the United States with a correlation coefficient (R) of 0.182 and weighted average of $82,852. Similarly, the statistical analysis conducted on geographies consisting of 107,629,543 people shows no correlation between the proportion of Yaqui and household income with householder between the ages 25 and 44 in the United States with a correlation coefficient (R) of -0.008 and weighted average of $81,656, a difference of 1.5%.
Householder Income Ages 25 - 44 years Correlation Summary
| Measurement | Senegalese | Yaqui |
| Minimum | $39,688 | $24,313 |
| Maximum | $141,023 | $118,928 |
| Range | $101,335 | $94,615 |
| Mean | $81,327 | $68,343 |
| Median | $78,521 | $68,776 |
| Interquartile 25% (IQ1) | $70,437 | $53,438 |
| Interquartile 75% (IQ3) | $90,994 | $83,858 |
| Interquartile Range (IQR) | $20,557 | $30,420 |
| Standard Deviation (Sample) | $20,178 | $22,560 |
| Standard Deviation (Population) | $19,975 | $22,236 |
Demographics Similar to Senegalese and Yaqui by Householder Income Ages 25 - 44 years
In terms of householder income ages 25 - 44 years, the demographic groups most similar to Senegalese are Pima ($82,821, a difference of 0.040%), Paiute ($82,984, a difference of 0.16%), Colville ($82,604, a difference of 0.30%), Immigrants from Belize ($83,141, a difference of 0.35%), and Immigrants from Jamaica ($83,298, a difference of 0.54%). Similarly, the demographic groups most similar to Yaqui are Potawatomi ($81,774, a difference of 0.14%), Blackfeet ($81,531, a difference of 0.15%), Cuban ($81,483, a difference of 0.21%), Bangladeshi ($81,363, a difference of 0.36%), and Liberian ($82,005, a difference of 0.43%).
| Demographics | Rating | Rank | Householder Income Ages 25 - 44 years |
| Immigrants | Jamaica | 0.2 /100 | #275 | Tragic $83,298 |
| Immigrants | Belize | 0.2 /100 | #276 | Tragic $83,141 |
| Paiute | 0.2 /100 | #277 | Tragic $82,984 |
| Senegalese | 0.2 /100 | #278 | Tragic $82,852 |
| Pima | 0.1 /100 | #279 | Tragic $82,821 |
| Colville | 0.1 /100 | #280 | Tragic $82,604 |
| Cajuns | 0.1 /100 | #281 | Tragic $82,393 |
| Central American Indians | 0.1 /100 | #282 | Tragic $82,355 |
| Guatemalans | 0.1 /100 | #283 | Tragic $82,331 |
| Immigrants | Middle Africa | 0.1 /100 | #284 | Tragic $82,254 |
| Immigrants | Somalia | 0.1 /100 | #285 | Tragic $82,188 |
| Ute | 0.1 /100 | #286 | Tragic $82,166 |
| Immigrants | Latin America | 0.1 /100 | #287 | Tragic $82,166 |
| Comanche | 0.1 /100 | #288 | Tragic $82,152 |
| Shoshone | 0.1 /100 | #289 | Tragic $82,062 |
| Liberians | 0.1 /100 | #290 | Tragic $82,005 |
| Potawatomi | 0.1 /100 | #291 | Tragic $81,774 |
| Yaqui | 0.1 /100 | #292 | Tragic $81,656 |
| Blackfeet | 0.1 /100 | #293 | Tragic $81,531 |
| Cubans | 0.1 /100 | #294 | Tragic $81,483 |
| Bangladeshis | 0.1 /100 | #295 | Tragic $81,363 |