Senegalese vs Moroccan Householder Income Ages 25 - 44 years
COMPARE
Senegalese
Moroccan
Householder Income Ages 25 - 44 years
Householder Income Ages 25 - 44 years Comparison
Senegalese
Moroccans
$82,852
HOUSEHOLDER INCOME AGES 25 - 44 YEARS
0.2/ 100
METRIC RATING
278th/ 347
METRIC RANK
$96,117
HOUSEHOLDER INCOME AGES 25 - 44 YEARS
70.3/ 100
METRIC RATING
155th/ 347
METRIC RANK
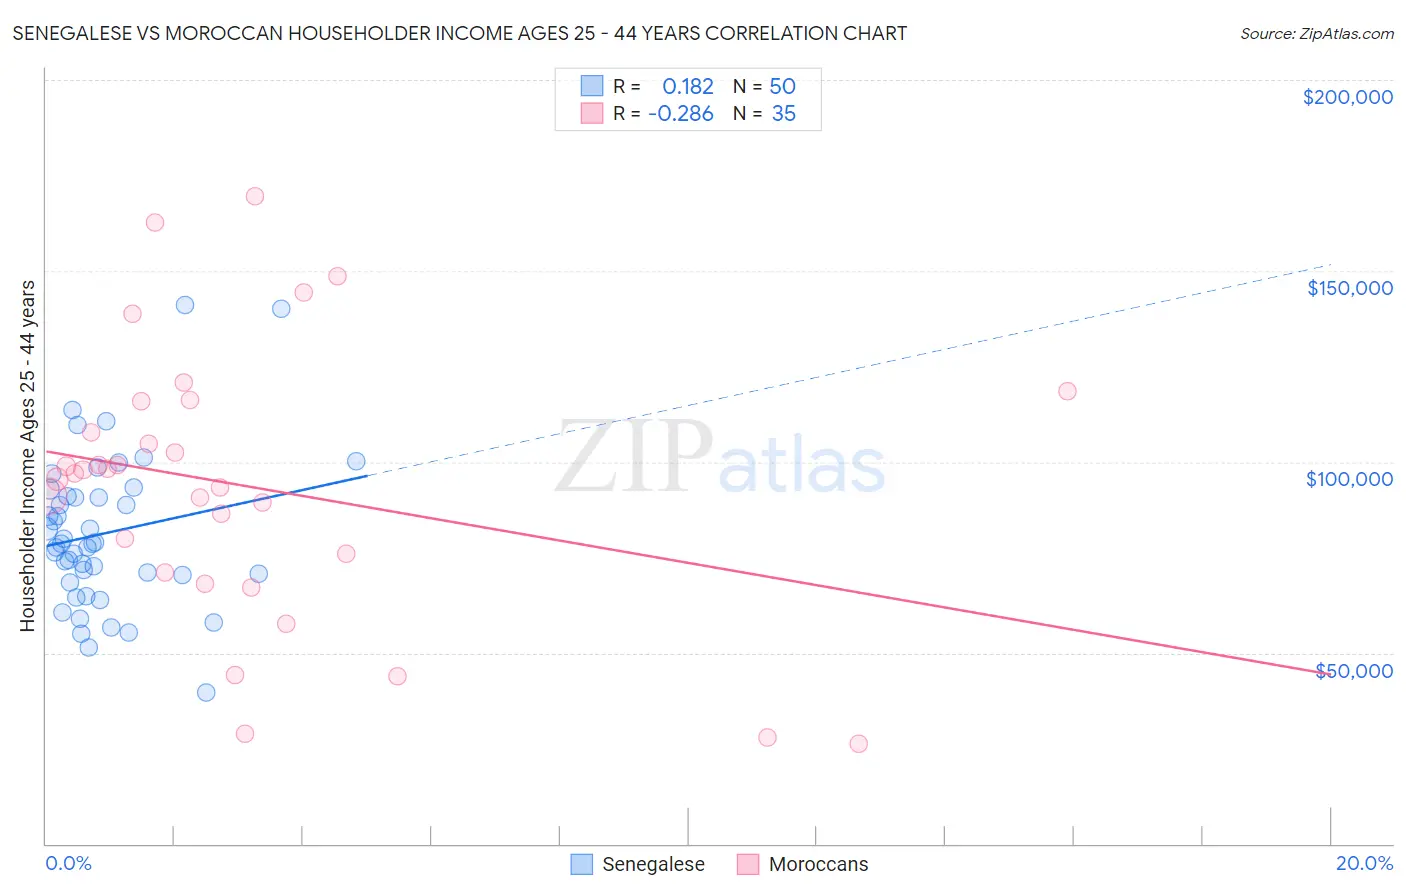
Senegalese vs Moroccan Householder Income Ages 25 - 44 years Correlation Chart
The statistical analysis conducted on geographies consisting of 78,048,769 people shows a poor positive correlation between the proportion of Senegalese and household income with householder between the ages 25 and 44 in the United States with a correlation coefficient (R) of 0.182 and weighted average of $82,852. Similarly, the statistical analysis conducted on geographies consisting of 201,535,372 people shows a weak negative correlation between the proportion of Moroccans and household income with householder between the ages 25 and 44 in the United States with a correlation coefficient (R) of -0.286 and weighted average of $96,117, a difference of 16.0%.
Householder Income Ages 25 - 44 years Correlation Summary
| Measurement | Senegalese | Moroccan |
| Minimum | $39,688 | $26,250 |
| Maximum | $141,023 | $169,563 |
| Range | $101,335 | $143,313 |
| Mean | $81,327 | $93,636 |
| Median | $78,521 | $96,963 |
| Interquartile 25% (IQ1) | $70,437 | $70,962 |
| Interquartile 75% (IQ3) | $90,994 | $115,732 |
| Interquartile Range (IQR) | $20,557 | $44,770 |
| Standard Deviation (Sample) | $20,178 | $35,487 |
| Standard Deviation (Population) | $19,975 | $34,976 |
Similar Demographics by Householder Income Ages 25 - 44 years
Demographics Similar to Senegalese by Householder Income Ages 25 - 44 years
In terms of householder income ages 25 - 44 years, the demographic groups most similar to Senegalese are Pima ($82,821, a difference of 0.040%), Paiute ($82,984, a difference of 0.16%), Colville ($82,604, a difference of 0.30%), Immigrants from Belize ($83,141, a difference of 0.35%), and Immigrants from Jamaica ($83,298, a difference of 0.54%).
| Demographics | Rating | Rank | Householder Income Ages 25 - 44 years |
| Somalis | 0.2 /100 | #271 | Tragic $83,752 |
| Spanish Americans | 0.2 /100 | #272 | Tragic $83,722 |
| Iroquois | 0.2 /100 | #273 | Tragic $83,682 |
| Marshallese | 0.2 /100 | #274 | Tragic $83,575 |
| Immigrants | Jamaica | 0.2 /100 | #275 | Tragic $83,298 |
| Immigrants | Belize | 0.2 /100 | #276 | Tragic $83,141 |
| Paiute | 0.2 /100 | #277 | Tragic $82,984 |
| Senegalese | 0.2 /100 | #278 | Tragic $82,852 |
| Pima | 0.1 /100 | #279 | Tragic $82,821 |
| Colville | 0.1 /100 | #280 | Tragic $82,604 |
| Cajuns | 0.1 /100 | #281 | Tragic $82,393 |
| Central American Indians | 0.1 /100 | #282 | Tragic $82,355 |
| Guatemalans | 0.1 /100 | #283 | Tragic $82,331 |
| Immigrants | Middle Africa | 0.1 /100 | #284 | Tragic $82,254 |
| Immigrants | Somalia | 0.1 /100 | #285 | Tragic $82,188 |
Demographics Similar to Moroccans by Householder Income Ages 25 - 44 years
In terms of householder income ages 25 - 44 years, the demographic groups most similar to Moroccans are Immigrants from Germany ($95,913, a difference of 0.21%), Slavic ($96,377, a difference of 0.27%), Slovene ($96,439, a difference of 0.33%), South American Indian ($96,497, a difference of 0.40%), and Czech ($96,525, a difference of 0.42%).
| Demographics | Rating | Rank | Householder Income Ages 25 - 44 years |
| Irish | 76.9 /100 | #148 | Good $96,730 |
| Basques | 76.6 /100 | #149 | Good $96,709 |
| Ugandans | 76.2 /100 | #150 | Good $96,667 |
| Czechs | 74.8 /100 | #151 | Good $96,525 |
| South American Indians | 74.5 /100 | #152 | Good $96,497 |
| Slovenes | 73.9 /100 | #153 | Good $96,439 |
| Slavs | 73.2 /100 | #154 | Good $96,377 |
| Moroccans | 70.3 /100 | #155 | Good $96,117 |
| Immigrants | Germany | 67.9 /100 | #156 | Good $95,913 |
| Immigrants | Uganda | 65.2 /100 | #157 | Good $95,698 |
| Scandinavians | 63.9 /100 | #158 | Good $95,596 |
| Costa Ricans | 63.5 /100 | #159 | Good $95,565 |
| Icelanders | 63.4 /100 | #160 | Good $95,560 |
| Immigrants | Portugal | 62.8 /100 | #161 | Good $95,512 |
| Swiss | 62.8 /100 | #162 | Good $95,511 |