Senegalese vs Immigrants from Caribbean 11th Grade
COMPARE
Senegalese
Immigrants from Caribbean
11th Grade
11th Grade Comparison
Senegalese
Immigrants from Caribbean
91.6%
11TH GRADE
1.4/ 100
METRIC RATING
244th/ 347
METRIC RANK
89.1%
11TH GRADE
0.0/ 100
METRIC RATING
313th/ 347
METRIC RANK
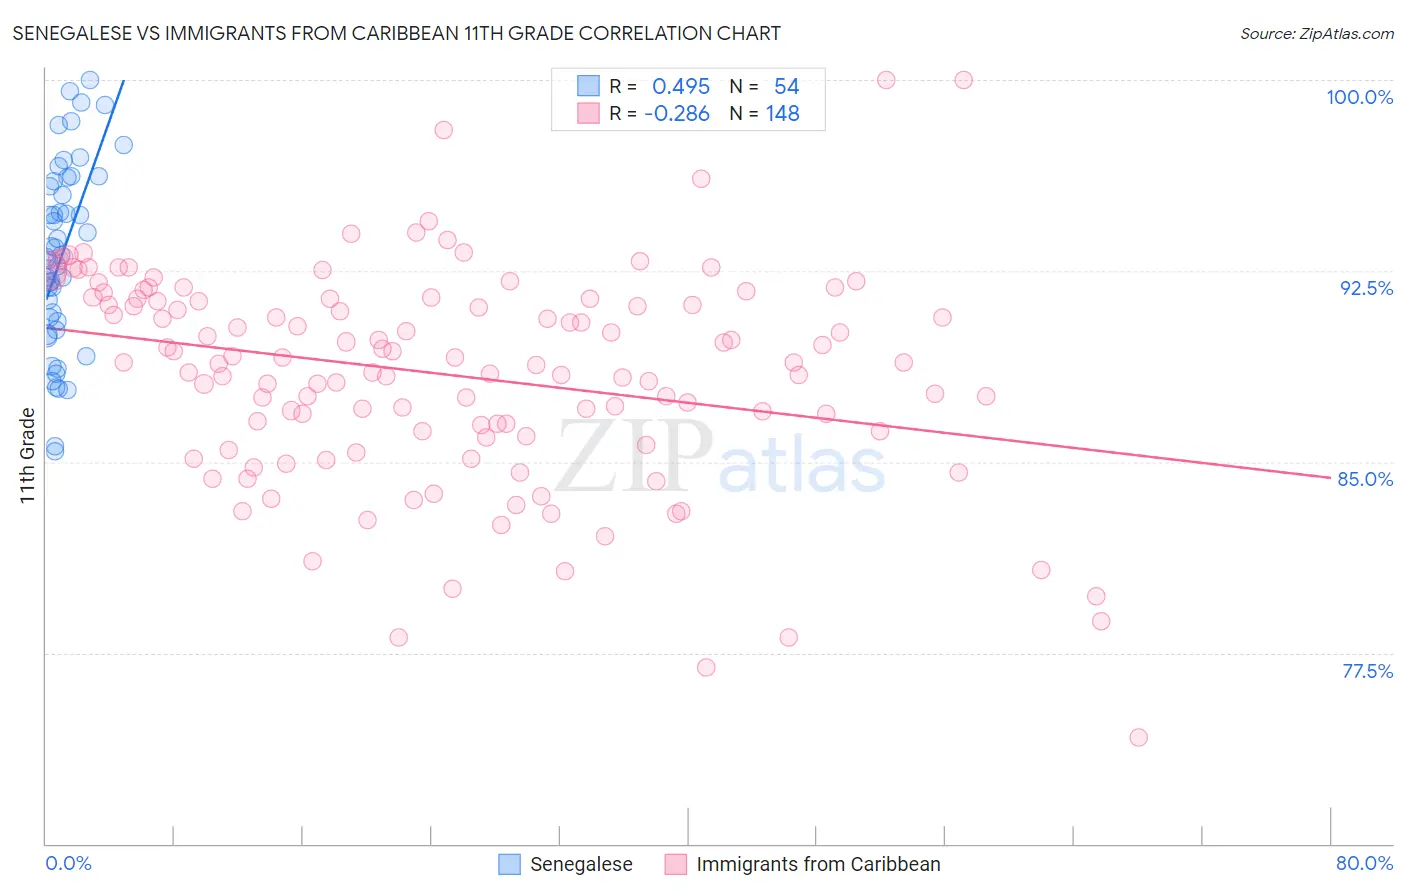
Senegalese vs Immigrants from Caribbean 11th Grade Correlation Chart
The statistical analysis conducted on geographies consisting of 78,142,569 people shows a moderate positive correlation between the proportion of Senegalese and percentage of population with at least 11th grade education in the United States with a correlation coefficient (R) of 0.495 and weighted average of 91.6%. Similarly, the statistical analysis conducted on geographies consisting of 450,064,731 people shows a weak negative correlation between the proportion of Immigrants from Caribbean and percentage of population with at least 11th grade education in the United States with a correlation coefficient (R) of -0.286 and weighted average of 89.1%, a difference of 2.8%.
11th Grade Correlation Summary
| Measurement | Senegalese | Immigrants from Caribbean |
| Minimum | 85.4% | 74.2% |
| Maximum | 100.0% | 100.0% |
| Range | 14.6% | 25.8% |
| Mean | 93.1% | 88.4% |
| Median | 93.1% | 88.9% |
| Interquartile 25% (IQ1) | 90.5% | 86.1% |
| Interquartile 75% (IQ3) | 96.0% | 91.4% |
| Interquartile Range (IQR) | 5.5% | 5.3% |
| Standard Deviation (Sample) | 3.6% | 4.3% |
| Standard Deviation (Population) | 3.6% | 4.2% |
Similar Demographics by 11th Grade
Demographics Similar to Senegalese by 11th Grade
In terms of 11th grade, the demographic groups most similar to Senegalese are Immigrants from Thailand (91.6%, a difference of 0.010%), African (91.5%, a difference of 0.010%), Immigrants from Middle Africa (91.6%, a difference of 0.030%), Seminole (91.5%, a difference of 0.050%), and Bahamian (91.6%, a difference of 0.070%).
| Demographics | Rating | Rank | 11th Grade |
| Immigrants | Bolivia | 2.8 /100 | #237 | Tragic 91.7% |
| Comanche | 2.6 /100 | #238 | Tragic 91.7% |
| Hopi | 2.5 /100 | #239 | Tragic 91.7% |
| South Americans | 2.0 /100 | #240 | Tragic 91.6% |
| Bahamians | 1.8 /100 | #241 | Tragic 91.6% |
| Immigrants | Middle Africa | 1.6 /100 | #242 | Tragic 91.6% |
| Immigrants | Thailand | 1.4 /100 | #243 | Tragic 91.6% |
| Senegalese | 1.4 /100 | #244 | Tragic 91.6% |
| Africans | 1.3 /100 | #245 | Tragic 91.5% |
| Seminole | 1.2 /100 | #246 | Tragic 91.5% |
| Immigrants | Philippines | 1.0 /100 | #247 | Tragic 91.5% |
| Immigrants | Uzbekistan | 1.0 /100 | #248 | Tragic 91.5% |
| Peruvians | 1.0 /100 | #249 | Tragic 91.5% |
| Ghanaians | 0.9 /100 | #250 | Tragic 91.5% |
| Immigrants | Costa Rica | 0.9 /100 | #251 | Tragic 91.4% |
Demographics Similar to Immigrants from Caribbean by 11th Grade
In terms of 11th grade, the demographic groups most similar to Immigrants from Caribbean are Cape Verdean (89.1%, a difference of 0.020%), Immigrants from Ecuador (89.1%, a difference of 0.030%), Immigrants from Cuba (88.9%, a difference of 0.18%), Lumbee (88.9%, a difference of 0.19%), and Immigrants from Portugal (89.3%, a difference of 0.20%).
| Demographics | Rating | Rank | 11th Grade |
| Ecuadorians | 0.0 /100 | #306 | Tragic 89.6% |
| Immigrants | Dominica | 0.0 /100 | #307 | Tragic 89.5% |
| Nepalese | 0.0 /100 | #308 | Tragic 89.5% |
| Immigrants | Bangladesh | 0.0 /100 | #309 | Tragic 89.5% |
| Yaqui | 0.0 /100 | #310 | Tragic 89.5% |
| Vietnamese | 0.0 /100 | #311 | Tragic 89.4% |
| Immigrants | Portugal | 0.0 /100 | #312 | Tragic 89.3% |
| Immigrants | Caribbean | 0.0 /100 | #313 | Tragic 89.1% |
| Cape Verdeans | 0.0 /100 | #314 | Tragic 89.1% |
| Immigrants | Ecuador | 0.0 /100 | #315 | Tragic 89.1% |
| Immigrants | Cuba | 0.0 /100 | #316 | Tragic 88.9% |
| Lumbee | 0.0 /100 | #317 | Tragic 88.9% |
| Nicaraguans | 0.0 /100 | #318 | Tragic 88.9% |
| Belizeans | 0.0 /100 | #319 | Tragic 88.8% |
| Immigrants | Armenia | 0.0 /100 | #320 | Tragic 88.8% |