Senegalese vs Immigrants from Caribbean 8th Grade
COMPARE
Senegalese
Immigrants from Caribbean
8th Grade
8th Grade Comparison
Senegalese
Immigrants from Caribbean
95.2%
8TH GRADE
2.7/ 100
METRIC RATING
236th/ 347
METRIC RANK
93.5%
8TH GRADE
0.0/ 100
METRIC RATING
313th/ 347
METRIC RANK
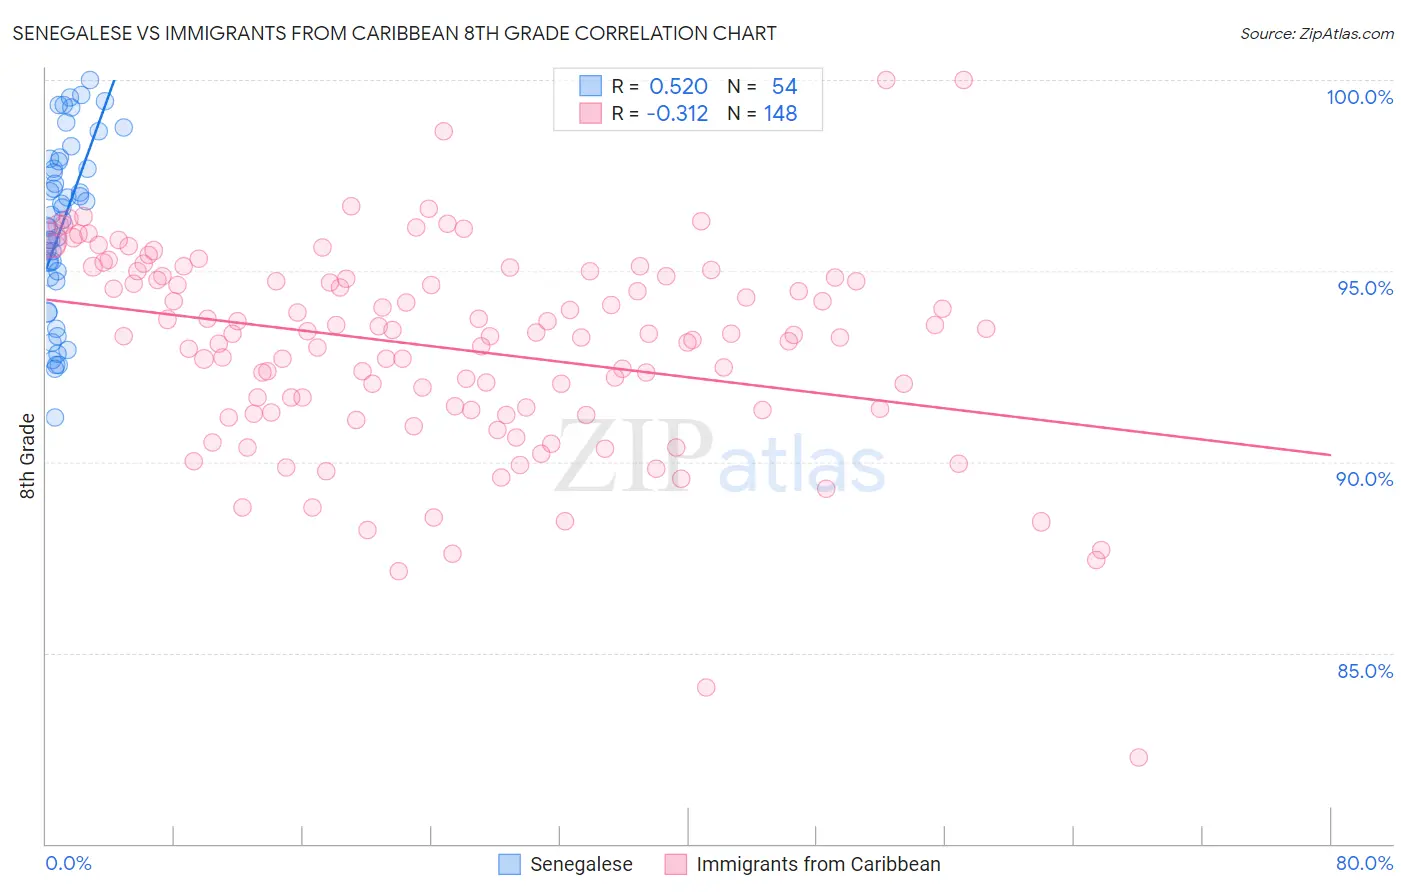
Senegalese vs Immigrants from Caribbean 8th Grade Correlation Chart
The statistical analysis conducted on geographies consisting of 78,142,569 people shows a substantial positive correlation between the proportion of Senegalese and percentage of population with at least 8th grade education in the United States with a correlation coefficient (R) of 0.520 and weighted average of 95.2%. Similarly, the statistical analysis conducted on geographies consisting of 450,064,731 people shows a mild negative correlation between the proportion of Immigrants from Caribbean and percentage of population with at least 8th grade education in the United States with a correlation coefficient (R) of -0.312 and weighted average of 93.5%, a difference of 1.8%.
8th Grade Correlation Summary
| Measurement | Senegalese | Immigrants from Caribbean |
| Minimum | 91.2% | 82.3% |
| Maximum | 100.0% | 100.0% |
| Range | 8.8% | 17.7% |
| Mean | 96.2% | 93.0% |
| Median | 96.4% | 93.3% |
| Interquartile 25% (IQ1) | 94.8% | 91.4% |
| Interquartile 75% (IQ3) | 97.9% | 94.8% |
| Interquartile Range (IQR) | 3.0% | 3.5% |
| Standard Deviation (Sample) | 2.3% | 2.7% |
| Standard Deviation (Population) | 2.2% | 2.7% |
Similar Demographics by 8th Grade
Demographics Similar to Senegalese by 8th Grade
In terms of 8th grade, the demographic groups most similar to Senegalese are Immigrants from Africa (95.2%, a difference of 0.0%), Nigerian (95.2%, a difference of 0.010%), Immigrants from Asia (95.2%, a difference of 0.020%), Costa Rican (95.2%, a difference of 0.020%), and Indian (Asian) (95.2%, a difference of 0.030%).
| Demographics | Rating | Rank | 8th Grade |
| Immigrants | Indonesia | 4.4 /100 | #229 | Tragic 95.3% |
| Immigrants | Panama | 4.1 /100 | #230 | Tragic 95.2% |
| Asians | 3.5 /100 | #231 | Tragic 95.2% |
| Indians (Asian) | 3.3 /100 | #232 | Tragic 95.2% |
| Immigrants | Asia | 3.1 /100 | #233 | Tragic 95.2% |
| Costa Ricans | 3.0 /100 | #234 | Tragic 95.2% |
| Nigerians | 2.9 /100 | #235 | Tragic 95.2% |
| Senegalese | 2.7 /100 | #236 | Tragic 95.2% |
| Immigrants | Africa | 2.7 /100 | #237 | Tragic 95.2% |
| Natives/Alaskans | 2.3 /100 | #238 | Tragic 95.2% |
| Immigrants | Sierra Leone | 2.1 /100 | #239 | Tragic 95.1% |
| Ethiopians | 2.0 /100 | #240 | Tragic 95.1% |
| South American Indians | 1.9 /100 | #241 | Tragic 95.1% |
| Tongans | 1.7 /100 | #242 | Tragic 95.1% |
| Paiute | 1.7 /100 | #243 | Tragic 95.1% |
Demographics Similar to Immigrants from Caribbean by 8th Grade
In terms of 8th grade, the demographic groups most similar to Immigrants from Caribbean are Immigrants from Vietnam (93.5%, a difference of 0.010%), Vietnamese (93.5%, a difference of 0.020%), Cape Verdean (93.5%, a difference of 0.030%), Immigrants (93.6%, a difference of 0.070%), and Japanese (93.6%, a difference of 0.070%).
| Demographics | Rating | Rank | 8th Grade |
| Immigrants | Guyana | 0.0 /100 | #306 | Tragic 93.8% |
| Immigrants | Portugal | 0.0 /100 | #307 | Tragic 93.8% |
| Ecuadorians | 0.0 /100 | #308 | Tragic 93.6% |
| Immigrants | Immigrants | 0.0 /100 | #309 | Tragic 93.6% |
| Japanese | 0.0 /100 | #310 | Tragic 93.6% |
| Immigrants | Bangladesh | 0.0 /100 | #311 | Tragic 93.6% |
| Cape Verdeans | 0.0 /100 | #312 | Tragic 93.5% |
| Immigrants | Caribbean | 0.0 /100 | #313 | Tragic 93.5% |
| Immigrants | Vietnam | 0.0 /100 | #314 | Tragic 93.5% |
| Vietnamese | 0.0 /100 | #315 | Tragic 93.5% |
| Immigrants | Cambodia | 0.0 /100 | #316 | Tragic 93.3% |
| Immigrants | Ecuador | 0.0 /100 | #317 | Tragic 93.3% |
| Puerto Ricans | 0.0 /100 | #318 | Tragic 93.2% |
| Immigrants | Cuba | 0.0 /100 | #319 | Tragic 93.2% |
| Immigrants | Fiji | 0.0 /100 | #320 | Tragic 93.2% |