Senegalese vs Immigrants from Caribbean Bachelor's Degree
COMPARE
Senegalese
Immigrants from Caribbean
Bachelor's Degree
Bachelor's Degree Comparison
Senegalese
Immigrants from Caribbean
37.5%
BACHELOR'S DEGREE
42.2/ 100
METRIC RATING
183rd/ 347
METRIC RANK
31.4%
BACHELOR'S DEGREE
0.1/ 100
METRIC RATING
282nd/ 347
METRIC RANK
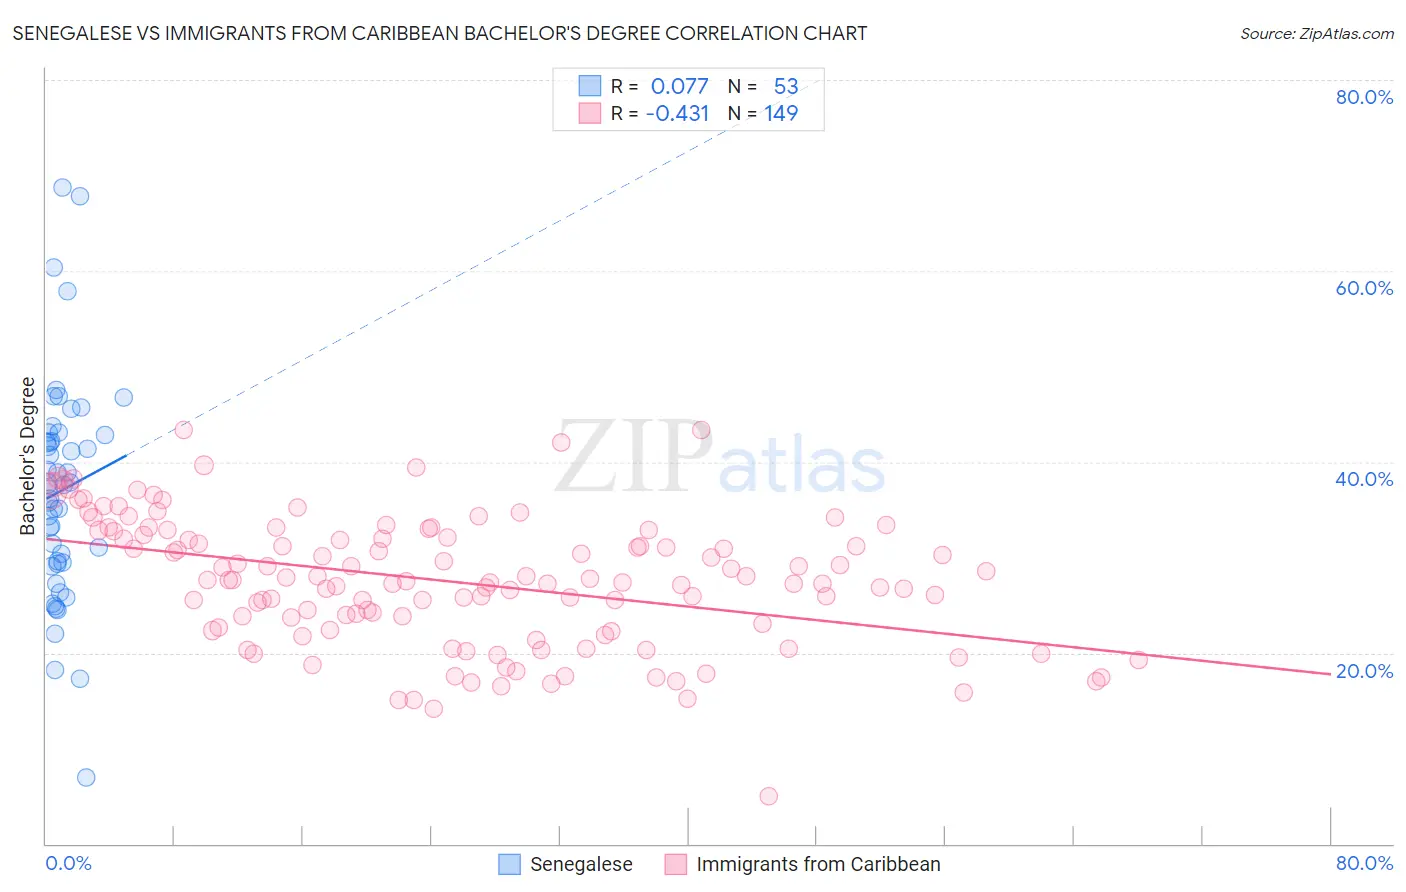
Senegalese vs Immigrants from Caribbean Bachelor's Degree Correlation Chart
The statistical analysis conducted on geographies consisting of 78,136,633 people shows a slight positive correlation between the proportion of Senegalese and percentage of population with at least bachelor's degree education in the United States with a correlation coefficient (R) of 0.077 and weighted average of 37.5%. Similarly, the statistical analysis conducted on geographies consisting of 450,021,690 people shows a moderate negative correlation between the proportion of Immigrants from Caribbean and percentage of population with at least bachelor's degree education in the United States with a correlation coefficient (R) of -0.431 and weighted average of 31.4%, a difference of 19.5%.
Bachelor's Degree Correlation Summary
| Measurement | Senegalese | Immigrants from Caribbean |
| Minimum | 6.9% | 4.9% |
| Maximum | 68.8% | 43.4% |
| Range | 61.9% | 38.5% |
| Mean | 37.0% | 27.5% |
| Median | 37.6% | 27.6% |
| Interquartile 25% (IQ1) | 29.4% | 22.5% |
| Interquartile 75% (IQ3) | 42.9% | 32.6% |
| Interquartile Range (IQR) | 13.5% | 10.1% |
| Standard Deviation (Sample) | 11.6% | 6.8% |
| Standard Deviation (Population) | 11.5% | 6.8% |
Similar Demographics by Bachelor's Degree
Demographics Similar to Senegalese by Bachelor's Degree
In terms of bachelor's degree, the demographic groups most similar to Senegalese are Scandinavian (37.5%, a difference of 0.040%), Immigrants from Peru (37.5%, a difference of 0.080%), Immigrants from Bosnia and Herzegovina (37.6%, a difference of 0.13%), Immigrants from Senegal (37.6%, a difference of 0.16%), and Norwegian (37.5%, a difference of 0.18%).
| Demographics | Rating | Rank | Bachelor's Degree |
| Costa Ricans | 47.6 /100 | #176 | Average 37.7% |
| Basques | 47.4 /100 | #177 | Average 37.7% |
| Immigrants | Cameroon | 46.8 /100 | #178 | Average 37.7% |
| Immigrants | Colombia | 45.4 /100 | #179 | Average 37.7% |
| Irish | 44.3 /100 | #180 | Average 37.6% |
| Immigrants | Senegal | 43.8 /100 | #181 | Average 37.6% |
| Immigrants | Bosnia and Herzegovina | 43.4 /100 | #182 | Average 37.6% |
| Senegalese | 42.2 /100 | #183 | Average 37.5% |
| Scandinavians | 41.7 /100 | #184 | Average 37.5% |
| Immigrants | Peru | 41.3 /100 | #185 | Average 37.5% |
| Norwegians | 40.4 /100 | #186 | Average 37.5% |
| English | 39.7 /100 | #187 | Fair 37.4% |
| Immigrants | Oceania | 37.3 /100 | #188 | Fair 37.3% |
| Slovaks | 36.9 /100 | #189 | Fair 37.3% |
| Swiss | 34.1 /100 | #190 | Fair 37.2% |
Demographics Similar to Immigrants from Caribbean by Bachelor's Degree
In terms of bachelor's degree, the demographic groups most similar to Immigrants from Caribbean are Blackfeet (31.5%, a difference of 0.15%), Honduran (31.3%, a difference of 0.28%), Haitian (31.3%, a difference of 0.31%), Aleut (31.3%, a difference of 0.32%), and Immigrants from El Salvador (31.3%, a difference of 0.38%).
| Demographics | Rating | Rank | Bachelor's Degree |
| Samoans | 0.1 /100 | #275 | Tragic 31.8% |
| Salvadorans | 0.1 /100 | #276 | Tragic 31.8% |
| Dominicans | 0.1 /100 | #277 | Tragic 31.8% |
| Marshallese | 0.1 /100 | #278 | Tragic 31.7% |
| Hawaiians | 0.1 /100 | #279 | Tragic 31.6% |
| Immigrants | Laos | 0.1 /100 | #280 | Tragic 31.6% |
| Blackfeet | 0.1 /100 | #281 | Tragic 31.5% |
| Immigrants | Caribbean | 0.1 /100 | #282 | Tragic 31.4% |
| Hondurans | 0.1 /100 | #283 | Tragic 31.3% |
| Haitians | 0.1 /100 | #284 | Tragic 31.3% |
| Aleuts | 0.1 /100 | #285 | Tragic 31.3% |
| Immigrants | El Salvador | 0.1 /100 | #286 | Tragic 31.3% |
| Ottawa | 0.1 /100 | #287 | Tragic 31.1% |
| Guatemalans | 0.1 /100 | #288 | Tragic 31.0% |
| Puerto Ricans | 0.1 /100 | #289 | Tragic 31.0% |