Senegalese vs Immigrants from Argentina Median Household Income
COMPARE
Senegalese
Immigrants from Argentina
Median Household Income
Median Household Income Comparison
Senegalese
Immigrants from Argentina
$74,999
MEDIAN HOUSEHOLD INCOME
0.2/ 100
METRIC RATING
280th/ 347
METRIC RANK
$92,417
MEDIAN HOUSEHOLD INCOME
99.1/ 100
METRIC RATING
84th/ 347
METRIC RANK
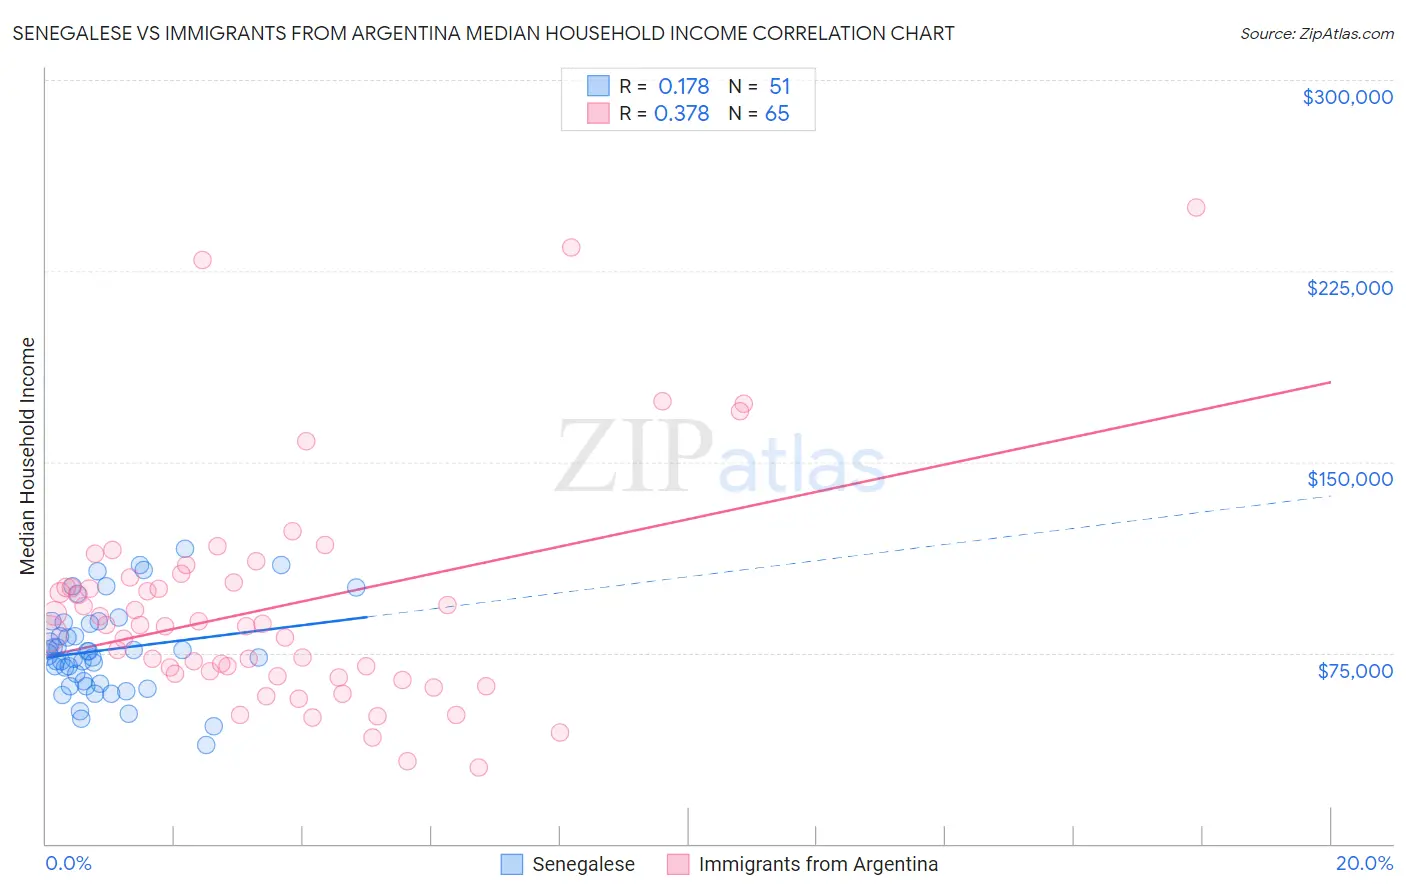
Senegalese vs Immigrants from Argentina Median Household Income Correlation Chart
The statistical analysis conducted on geographies consisting of 78,073,894 people shows a poor positive correlation between the proportion of Senegalese and median household income in the United States with a correlation coefficient (R) of 0.178 and weighted average of $74,999. Similarly, the statistical analysis conducted on geographies consisting of 264,333,035 people shows a mild positive correlation between the proportion of Immigrants from Argentina and median household income in the United States with a correlation coefficient (R) of 0.378 and weighted average of $92,417, a difference of 23.2%.
Median Household Income Correlation Summary
| Measurement | Senegalese | Immigrants from Argentina |
| Minimum | $38,686 | $29,759 |
| Maximum | $116,116 | $250,001 |
| Range | $77,430 | $220,242 |
| Mean | $76,167 | $92,999 |
| Median | $74,286 | $85,824 |
| Interquartile 25% (IQ1) | $62,685 | $66,317 |
| Interquartile 75% (IQ3) | $87,125 | $103,452 |
| Interquartile Range (IQR) | $24,440 | $37,135 |
| Standard Deviation (Sample) | $17,624 | $44,164 |
| Standard Deviation (Population) | $17,451 | $43,823 |
Similar Demographics by Median Household Income
Demographics Similar to Senegalese by Median Household Income
In terms of median household income, the demographic groups most similar to Senegalese are Immigrants from Liberia ($74,896, a difference of 0.14%), Immigrants from Guatemala ($75,123, a difference of 0.16%), Central American Indian ($74,847, a difference of 0.20%), Osage ($75,240, a difference of 0.32%), and Cree ($74,685, a difference of 0.42%).
| Demographics | Rating | Rank | Median Household Income |
| Liberians | 0.2 /100 | #273 | Tragic $75,667 |
| British West Indians | 0.2 /100 | #274 | Tragic $75,647 |
| Immigrants | Micronesia | 0.2 /100 | #275 | Tragic $75,574 |
| Immigrants | Latin America | 0.2 /100 | #276 | Tragic $75,420 |
| Spanish Americans | 0.2 /100 | #277 | Tragic $75,386 |
| Osage | 0.2 /100 | #278 | Tragic $75,240 |
| Immigrants | Guatemala | 0.2 /100 | #279 | Tragic $75,123 |
| Senegalese | 0.2 /100 | #280 | Tragic $74,999 |
| Immigrants | Liberia | 0.1 /100 | #281 | Tragic $74,896 |
| Central American Indians | 0.1 /100 | #282 | Tragic $74,847 |
| Cree | 0.1 /100 | #283 | Tragic $74,685 |
| Yaqui | 0.1 /100 | #284 | Tragic $74,596 |
| Mexicans | 0.1 /100 | #285 | Tragic $74,399 |
| Immigrants | Somalia | 0.1 /100 | #286 | Tragic $74,300 |
| Iroquois | 0.1 /100 | #287 | Tragic $74,279 |
Demographics Similar to Immigrants from Argentina by Median Household Income
In terms of median household income, the demographic groups most similar to Immigrants from Argentina are Italian ($92,475, a difference of 0.060%), Immigrants from Croatia ($92,225, a difference of 0.21%), Immigrants from Spain ($92,732, a difference of 0.34%), Immigrants from England ($92,098, a difference of 0.35%), and Immigrants from Hungary ($92,094, a difference of 0.35%).
| Demographics | Rating | Rank | Median Household Income |
| Immigrants | Afghanistan | 99.5 /100 | #77 | Exceptional $93,375 |
| Immigrants | Bulgaria | 99.4 /100 | #78 | Exceptional $93,148 |
| Sri Lankans | 99.4 /100 | #79 | Exceptional $93,093 |
| Tongans | 99.4 /100 | #80 | Exceptional $93,076 |
| Immigrants | Eastern Europe | 99.4 /100 | #81 | Exceptional $93,051 |
| Immigrants | Spain | 99.3 /100 | #82 | Exceptional $92,732 |
| Italians | 99.1 /100 | #83 | Exceptional $92,475 |
| Immigrants | Argentina | 99.1 /100 | #84 | Exceptional $92,417 |
| Immigrants | Croatia | 99.0 /100 | #85 | Exceptional $92,225 |
| Immigrants | England | 98.9 /100 | #86 | Exceptional $92,098 |
| Immigrants | Hungary | 98.9 /100 | #87 | Exceptional $92,094 |
| Immigrants | Canada | 98.8 /100 | #88 | Exceptional $92,029 |
| Romanians | 98.8 /100 | #89 | Exceptional $91,994 |
| Assyrians/Chaldeans/Syriacs | 98.8 /100 | #90 | Exceptional $91,991 |
| Immigrants | Vietnam | 98.8 /100 | #91 | Exceptional $91,987 |