Senegalese vs Slovak Median Household Income
COMPARE
Senegalese
Slovak
Median Household Income
Median Household Income Comparison
Senegalese
Slovaks
$74,999
MEDIAN HOUSEHOLD INCOME
0.2/ 100
METRIC RATING
280th/ 347
METRIC RANK
$83,798
MEDIAN HOUSEHOLD INCOME
30.2/ 100
METRIC RATING
190th/ 347
METRIC RANK
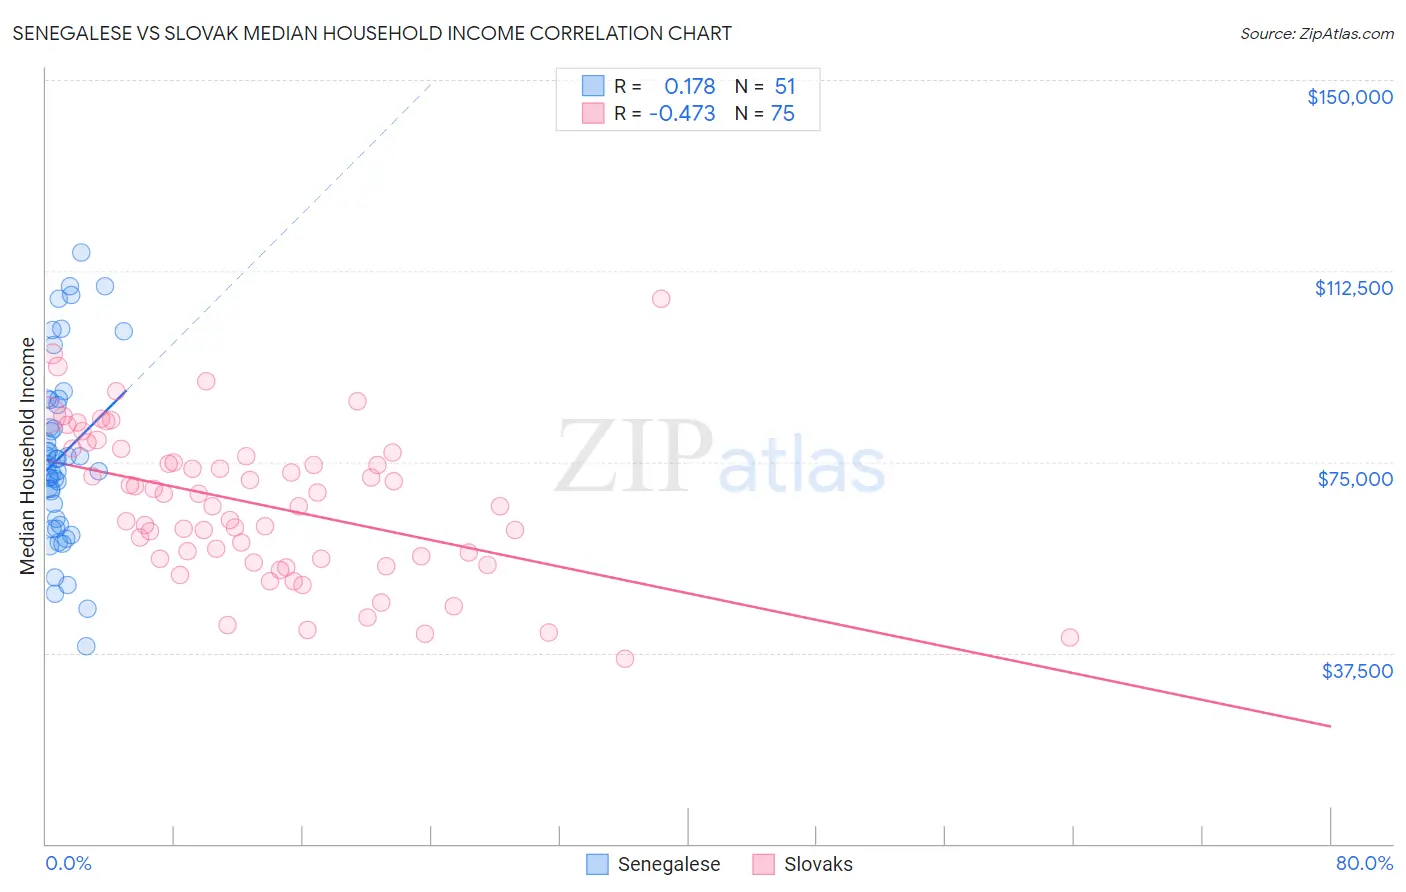
Senegalese vs Slovak Median Household Income Correlation Chart
The statistical analysis conducted on geographies consisting of 78,073,894 people shows a poor positive correlation between the proportion of Senegalese and median household income in the United States with a correlation coefficient (R) of 0.178 and weighted average of $74,999. Similarly, the statistical analysis conducted on geographies consisting of 397,588,666 people shows a moderate negative correlation between the proportion of Slovaks and median household income in the United States with a correlation coefficient (R) of -0.473 and weighted average of $83,798, a difference of 11.7%.
Median Household Income Correlation Summary
| Measurement | Senegalese | Slovak |
| Minimum | $38,686 | $36,453 |
| Maximum | $116,116 | $106,990 |
| Range | $77,430 | $70,537 |
| Mean | $76,167 | $66,640 |
| Median | $74,286 | $66,359 |
| Interquartile 25% (IQ1) | $62,685 | $55,938 |
| Interquartile 75% (IQ3) | $87,125 | $76,771 |
| Interquartile Range (IQR) | $24,440 | $20,833 |
| Standard Deviation (Sample) | $17,624 | $14,677 |
| Standard Deviation (Population) | $17,451 | $14,579 |
Similar Demographics by Median Household Income
Demographics Similar to Senegalese by Median Household Income
In terms of median household income, the demographic groups most similar to Senegalese are Immigrants from Liberia ($74,896, a difference of 0.14%), Immigrants from Guatemala ($75,123, a difference of 0.16%), Central American Indian ($74,847, a difference of 0.20%), Osage ($75,240, a difference of 0.32%), and Cree ($74,685, a difference of 0.42%).
| Demographics | Rating | Rank | Median Household Income |
| Liberians | 0.2 /100 | #273 | Tragic $75,667 |
| British West Indians | 0.2 /100 | #274 | Tragic $75,647 |
| Immigrants | Micronesia | 0.2 /100 | #275 | Tragic $75,574 |
| Immigrants | Latin America | 0.2 /100 | #276 | Tragic $75,420 |
| Spanish Americans | 0.2 /100 | #277 | Tragic $75,386 |
| Osage | 0.2 /100 | #278 | Tragic $75,240 |
| Immigrants | Guatemala | 0.2 /100 | #279 | Tragic $75,123 |
| Senegalese | 0.2 /100 | #280 | Tragic $74,999 |
| Immigrants | Liberia | 0.1 /100 | #281 | Tragic $74,896 |
| Central American Indians | 0.1 /100 | #282 | Tragic $74,847 |
| Cree | 0.1 /100 | #283 | Tragic $74,685 |
| Yaqui | 0.1 /100 | #284 | Tragic $74,596 |
| Mexicans | 0.1 /100 | #285 | Tragic $74,399 |
| Immigrants | Somalia | 0.1 /100 | #286 | Tragic $74,300 |
| Iroquois | 0.1 /100 | #287 | Tragic $74,279 |
Demographics Similar to Slovaks by Median Household Income
In terms of median household income, the demographic groups most similar to Slovaks are Iraqi ($83,753, a difference of 0.050%), Immigrants from Colombia ($83,902, a difference of 0.12%), Tlingit-Haida ($83,968, a difference of 0.20%), Welsh ($83,628, a difference of 0.20%), and Finnish ($83,607, a difference of 0.23%).
| Demographics | Rating | Rank | Median Household Income |
| Spaniards | 42.7 /100 | #183 | Average $84,644 |
| Immigrants | Eastern Africa | 37.4 /100 | #184 | Fair $84,299 |
| Kenyans | 34.2 /100 | #185 | Fair $84,085 |
| Puget Sound Salish | 33.2 /100 | #186 | Fair $84,011 |
| Belgians | 33.2 /100 | #187 | Fair $84,008 |
| Tlingit-Haida | 32.6 /100 | #188 | Fair $83,968 |
| Immigrants | Colombia | 31.7 /100 | #189 | Fair $83,902 |
| Slovaks | 30.2 /100 | #190 | Fair $83,798 |
| Iraqis | 29.6 /100 | #191 | Fair $83,753 |
| Welsh | 28.0 /100 | #192 | Fair $83,628 |
| Finns | 27.7 /100 | #193 | Fair $83,607 |
| Ghanaians | 27.4 /100 | #194 | Fair $83,582 |
| Immigrants | Armenia | 27.0 /100 | #195 | Fair $83,555 |
| French | 26.0 /100 | #196 | Fair $83,468 |
| Aleuts | 25.7 /100 | #197 | Fair $83,446 |