Vietnamese vs Trinidadian and Tobagonian Median Family Income
COMPARE
Vietnamese
Trinidadian and Tobagonian
Median Family Income
Median Family Income Comparison
Vietnamese
Trinidadians and Tobagonians
$96,123
MEDIAN FAMILY INCOME
3.4/ 100
METRIC RATING
225th/ 347
METRIC RANK
$94,466
MEDIAN FAMILY INCOME
1.5/ 100
METRIC RATING
236th/ 347
METRIC RANK
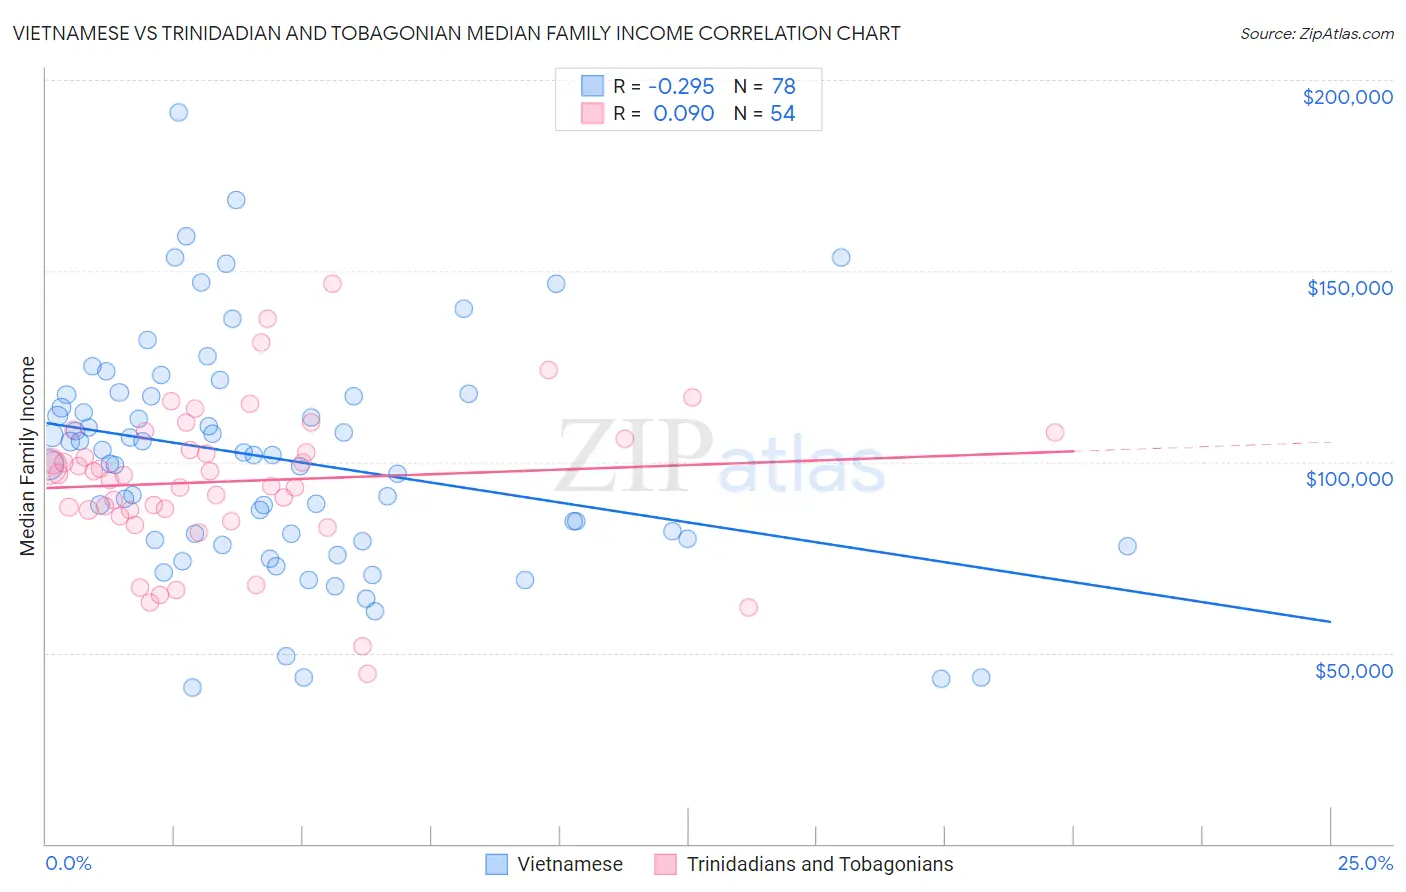
Vietnamese vs Trinidadian and Tobagonian Median Family Income Correlation Chart
The statistical analysis conducted on geographies consisting of 170,610,316 people shows a weak negative correlation between the proportion of Vietnamese and median family income in the United States with a correlation coefficient (R) of -0.295 and weighted average of $96,123. Similarly, the statistical analysis conducted on geographies consisting of 219,638,345 people shows a slight positive correlation between the proportion of Trinidadians and Tobagonians and median family income in the United States with a correlation coefficient (R) of 0.090 and weighted average of $94,466, a difference of 1.8%.
Median Family Income Correlation Summary
| Measurement | Vietnamese | Trinidadian and Tobagonian |
| Minimum | $40,807 | $44,583 |
| Maximum | $191,643 | $146,767 |
| Range | $150,837 | $102,184 |
| Mean | $100,636 | $94,928 |
| Median | $101,824 | $96,651 |
| Interquartile 25% (IQ1) | $79,608 | $87,494 |
| Interquartile 75% (IQ3) | $117,250 | $106,050 |
| Interquartile Range (IQR) | $37,642 | $18,556 |
| Standard Deviation (Sample) | $30,077 | $19,692 |
| Standard Deviation (Population) | $29,884 | $19,508 |
Demographics Similar to Vietnamese and Trinidadians and Tobagonians by Median Family Income
In terms of median family income, the demographic groups most similar to Vietnamese are Nonimmigrants ($96,231, a difference of 0.11%), Venezuelan ($96,281, a difference of 0.16%), Immigrants from Nigeria ($96,439, a difference of 0.33%), Immigrants from Ghana ($96,544, a difference of 0.44%), and Immigrants from Panama ($95,647, a difference of 0.50%). Similarly, the demographic groups most similar to Trinidadians and Tobagonians are Immigrants from Burma/Myanmar ($94,472, a difference of 0.010%), Alaskan Athabascan ($94,429, a difference of 0.040%), Immigrants from Western Africa ($94,638, a difference of 0.18%), Immigrants from Bangladesh ($94,665, a difference of 0.21%), and Nepalese ($94,153, a difference of 0.33%).
| Demographics | Rating | Rank | Median Family Income |
| Sudanese | 4.7 /100 | #220 | Tragic $96,783 |
| Immigrants | Ghana | 4.2 /100 | #221 | Tragic $96,544 |
| Immigrants | Nigeria | 4.0 /100 | #222 | Tragic $96,439 |
| Venezuelans | 3.7 /100 | #223 | Tragic $96,281 |
| Immigrants | Nonimmigrants | 3.6 /100 | #224 | Tragic $96,231 |
| Vietnamese | 3.4 /100 | #225 | Tragic $96,123 |
| Immigrants | Panama | 2.7 /100 | #226 | Tragic $95,647 |
| Alaska Natives | 2.6 /100 | #227 | Tragic $95,573 |
| Immigrants | Azores | 2.4 /100 | #228 | Tragic $95,402 |
| Marshallese | 2.2 /100 | #229 | Tragic $95,293 |
| Malaysians | 2.2 /100 | #230 | Tragic $95,230 |
| Ecuadorians | 2.1 /100 | #231 | Tragic $95,114 |
| Immigrants | Venezuela | 1.9 /100 | #232 | Tragic $94,904 |
| Immigrants | Bangladesh | 1.6 /100 | #233 | Tragic $94,665 |
| Immigrants | Western Africa | 1.6 /100 | #234 | Tragic $94,638 |
| Immigrants | Burma/Myanmar | 1.5 /100 | #235 | Tragic $94,472 |
| Trinidadians and Tobagonians | 1.5 /100 | #236 | Tragic $94,466 |
| Alaskan Athabascans | 1.5 /100 | #237 | Tragic $94,429 |
| Nepalese | 1.3 /100 | #238 | Tragic $94,153 |
| Salvadorans | 1.2 /100 | #239 | Tragic $94,109 |
| Somalis | 1.2 /100 | #240 | Tragic $94,085 |