Egyptian vs Trinidadian and Tobagonian Median Family Income
COMPARE
Egyptian
Trinidadian and Tobagonian
Median Family Income
Median Family Income Comparison
Egyptians
Trinidadians and Tobagonians
$114,119
MEDIAN FAMILY INCOME
99.7/ 100
METRIC RATING
65th/ 347
METRIC RANK
$94,466
MEDIAN FAMILY INCOME
1.5/ 100
METRIC RATING
236th/ 347
METRIC RANK
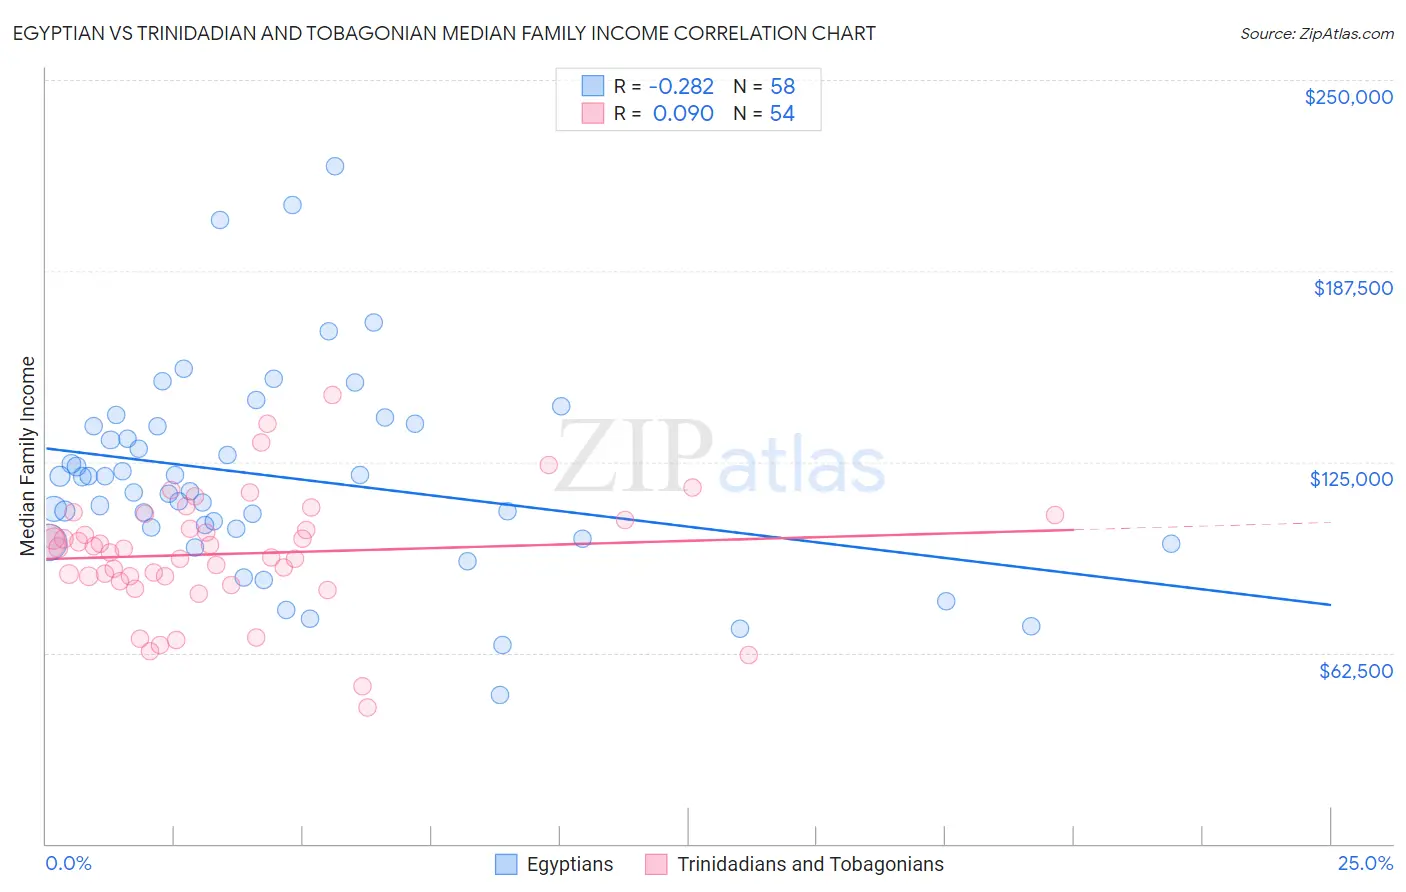
Egyptian vs Trinidadian and Tobagonian Median Family Income Correlation Chart
The statistical analysis conducted on geographies consisting of 276,687,434 people shows a weak negative correlation between the proportion of Egyptians and median family income in the United States with a correlation coefficient (R) of -0.282 and weighted average of $114,119. Similarly, the statistical analysis conducted on geographies consisting of 219,638,345 people shows a slight positive correlation between the proportion of Trinidadians and Tobagonians and median family income in the United States with a correlation coefficient (R) of 0.090 and weighted average of $94,466, a difference of 20.8%.
Median Family Income Correlation Summary
| Measurement | Egyptian | Trinidadian and Tobagonian |
| Minimum | $48,661 | $44,583 |
| Maximum | $221,912 | $146,767 |
| Range | $173,251 | $102,184 |
| Mean | $119,991 | $94,928 |
| Median | $117,654 | $96,651 |
| Interquartile 25% (IQ1) | $103,125 | $87,494 |
| Interquartile 75% (IQ3) | $136,794 | $106,050 |
| Interquartile Range (IQR) | $33,669 | $18,556 |
| Standard Deviation (Sample) | $33,329 | $19,692 |
| Standard Deviation (Population) | $33,040 | $19,508 |
Similar Demographics by Median Family Income
Demographics Similar to Egyptians by Median Family Income
In terms of median family income, the demographic groups most similar to Egyptians are Paraguayan ($114,016, a difference of 0.090%), Immigrants from Scotland ($114,392, a difference of 0.24%), Immigrants from Pakistan ($114,406, a difference of 0.25%), Immigrants from Spain ($113,815, a difference of 0.27%), and Mongolian ($114,553, a difference of 0.38%).
| Demographics | Rating | Rank | Median Family Income |
| Immigrants | Indonesia | 99.8 /100 | #58 | Exceptional $115,162 |
| Immigrants | Netherlands | 99.8 /100 | #59 | Exceptional $114,987 |
| Immigrants | Latvia | 99.8 /100 | #60 | Exceptional $114,826 |
| Immigrants | Belarus | 99.8 /100 | #61 | Exceptional $114,586 |
| Mongolians | 99.8 /100 | #62 | Exceptional $114,553 |
| Immigrants | Pakistan | 99.8 /100 | #63 | Exceptional $114,406 |
| Immigrants | Scotland | 99.7 /100 | #64 | Exceptional $114,392 |
| Egyptians | 99.7 /100 | #65 | Exceptional $114,119 |
| Paraguayans | 99.7 /100 | #66 | Exceptional $114,016 |
| Immigrants | Spain | 99.7 /100 | #67 | Exceptional $113,815 |
| Immigrants | Serbia | 99.6 /100 | #68 | Exceptional $113,463 |
| Immigrants | Bulgaria | 99.6 /100 | #69 | Exceptional $113,461 |
| Immigrants | Romania | 99.6 /100 | #70 | Exceptional $113,434 |
| South Africans | 99.5 /100 | #71 | Exceptional $113,229 |
| Afghans | 99.5 /100 | #72 | Exceptional $112,971 |
Demographics Similar to Trinidadians and Tobagonians by Median Family Income
In terms of median family income, the demographic groups most similar to Trinidadians and Tobagonians are Immigrants from Burma/Myanmar ($94,472, a difference of 0.010%), Alaskan Athabascan ($94,429, a difference of 0.040%), Immigrants from Western Africa ($94,638, a difference of 0.18%), Immigrants from Bangladesh ($94,665, a difference of 0.21%), and Nepalese ($94,153, a difference of 0.33%).
| Demographics | Rating | Rank | Median Family Income |
| Marshallese | 2.2 /100 | #229 | Tragic $95,293 |
| Malaysians | 2.2 /100 | #230 | Tragic $95,230 |
| Ecuadorians | 2.1 /100 | #231 | Tragic $95,114 |
| Immigrants | Venezuela | 1.9 /100 | #232 | Tragic $94,904 |
| Immigrants | Bangladesh | 1.6 /100 | #233 | Tragic $94,665 |
| Immigrants | Western Africa | 1.6 /100 | #234 | Tragic $94,638 |
| Immigrants | Burma/Myanmar | 1.5 /100 | #235 | Tragic $94,472 |
| Trinidadians and Tobagonians | 1.5 /100 | #236 | Tragic $94,466 |
| Alaskan Athabascans | 1.5 /100 | #237 | Tragic $94,429 |
| Nepalese | 1.3 /100 | #238 | Tragic $94,153 |
| Salvadorans | 1.2 /100 | #239 | Tragic $94,109 |
| Somalis | 1.2 /100 | #240 | Tragic $94,085 |
| Immigrants | Trinidad and Tobago | 1.2 /100 | #241 | Tragic $93,988 |
| Barbadians | 1.1 /100 | #242 | Tragic $93,919 |
| German Russians | 1.1 /100 | #243 | Tragic $93,858 |