Scotch-Irish vs Malaysian Householder Income Under 25 years
COMPARE
Scotch-Irish
Malaysian
Householder Income Under 25 years
Householder Income Under 25 years Comparison
Scotch-Irish
Malaysians
$49,039
HOUSEHOLDER INCOME UNDER 25 YEARS
0.0/ 100
METRIC RATING
285th/ 347
METRIC RANK
$51,615
HOUSEHOLDER INCOME UNDER 25 YEARS
19.7/ 100
METRIC RATING
190th/ 347
METRIC RANK
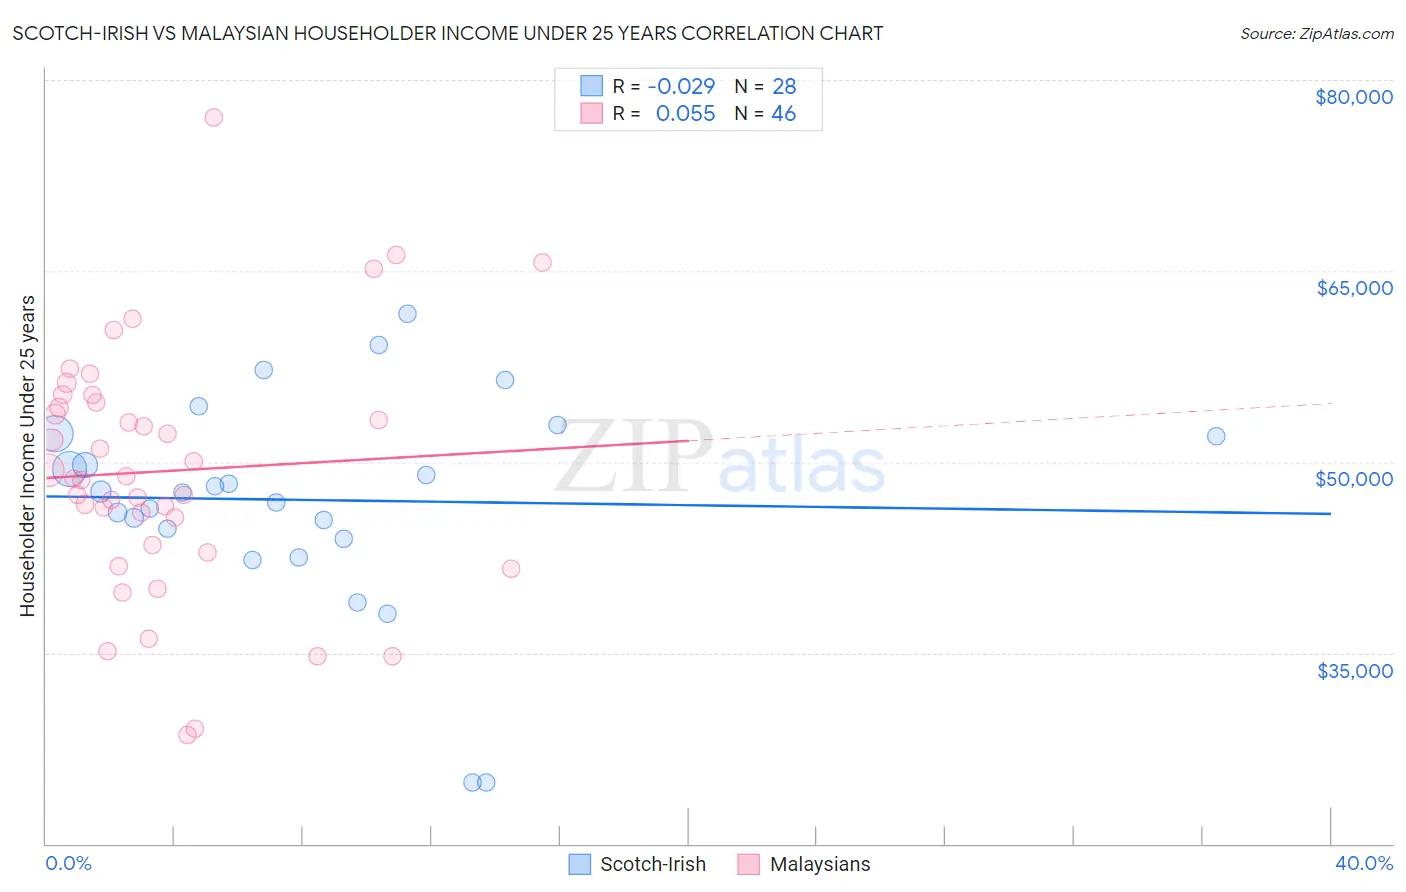
Scotch-Irish vs Malaysian Householder Income Under 25 years Correlation Chart
The statistical analysis conducted on geographies consisting of 427,674,236 people shows no correlation between the proportion of Scotch-Irish and household income with householder under the age of 25 in the United States with a correlation coefficient (R) of -0.029 and weighted average of $49,039. Similarly, the statistical analysis conducted on geographies consisting of 207,003,790 people shows a slight positive correlation between the proportion of Malaysians and household income with householder under the age of 25 in the United States with a correlation coefficient (R) of 0.055 and weighted average of $51,615, a difference of 5.2%.
Householder Income Under 25 years Correlation Summary
| Measurement | Scotch-Irish | Malaysian |
| Minimum | $24,821 | $28,500 |
| Maximum | $61,601 | $77,081 |
| Range | $36,780 | $48,581 |
| Mean | $47,004 | $49,286 |
| Median | $47,645 | $48,791 |
| Interquartile 25% (IQ1) | $44,331 | $43,424 |
| Interquartile 75% (IQ3) | $52,103 | $54,664 |
| Interquartile Range (IQR) | $7,772 | $11,240 |
| Standard Deviation (Sample) | $8,411 | $9,769 |
| Standard Deviation (Population) | $8,259 | $9,663 |
Similar Demographics by Householder Income Under 25 years
Demographics Similar to Scotch-Irish by Householder Income Under 25 years
In terms of householder income under 25 years, the demographic groups most similar to Scotch-Irish are French American Indian ($48,977, a difference of 0.13%), Carpatho Rusyn ($49,113, a difference of 0.15%), Senegalese ($48,953, a difference of 0.18%), Liberian ($48,917, a difference of 0.25%), and Immigrants from Nigeria ($49,174, a difference of 0.28%).
| Demographics | Rating | Rank | Householder Income Under 25 years |
| Nigerians | 0.1 /100 | #278 | Tragic $49,416 |
| Apache | 0.1 /100 | #279 | Tragic $49,395 |
| Hmong | 0.1 /100 | #280 | Tragic $49,364 |
| Immigrants | Nonimmigrants | 0.1 /100 | #281 | Tragic $49,348 |
| Alsatians | 0.1 /100 | #282 | Tragic $49,267 |
| Immigrants | Nigeria | 0.1 /100 | #283 | Tragic $49,174 |
| Carpatho Rusyns | 0.1 /100 | #284 | Tragic $49,113 |
| Scotch-Irish | 0.0 /100 | #285 | Tragic $49,039 |
| French American Indians | 0.0 /100 | #286 | Tragic $48,977 |
| Senegalese | 0.0 /100 | #287 | Tragic $48,953 |
| Liberians | 0.0 /100 | #288 | Tragic $48,917 |
| Hondurans | 0.0 /100 | #289 | Tragic $48,885 |
| Americans | 0.0 /100 | #290 | Tragic $48,860 |
| Immigrants | Burma/Myanmar | 0.0 /100 | #291 | Tragic $48,749 |
| Shoshone | 0.0 /100 | #292 | Tragic $48,720 |
Demographics Similar to Malaysians by Householder Income Under 25 years
In terms of householder income under 25 years, the demographic groups most similar to Malaysians are Panamanian ($51,611, a difference of 0.010%), West Indian ($51,583, a difference of 0.060%), Immigrants from Eritrea ($51,574, a difference of 0.080%), Croatian ($51,662, a difference of 0.090%), and Northern European ($51,678, a difference of 0.12%).
| Demographics | Rating | Rank | Householder Income Under 25 years |
| Mexican American Indians | 27.0 /100 | #183 | Fair $51,783 |
| Paiute | 25.1 /100 | #184 | Fair $51,743 |
| Immigrants | Latvia | 24.8 /100 | #185 | Fair $51,737 |
| Alaskan Athabascans | 23.8 /100 | #186 | Fair $51,713 |
| Immigrants | South Africa | 23.4 /100 | #187 | Fair $51,705 |
| Northern Europeans | 22.2 /100 | #188 | Fair $51,678 |
| Croatians | 21.6 /100 | #189 | Fair $51,662 |
| Malaysians | 19.7 /100 | #190 | Poor $51,615 |
| Panamanians | 19.5 /100 | #191 | Poor $51,611 |
| West Indians | 18.5 /100 | #192 | Poor $51,583 |
| Immigrants | Eritrea | 18.1 /100 | #193 | Poor $51,574 |
| Guatemalans | 16.4 /100 | #194 | Poor $51,525 |
| Estonians | 16.4 /100 | #195 | Poor $51,523 |
| Palestinians | 16.1 /100 | #196 | Poor $51,515 |
| Pima | 15.7 /100 | #197 | Poor $51,503 |