Scotch-Irish vs Slovak Householder Income Under 25 years
COMPARE
Scotch-Irish
Slovak
Householder Income Under 25 years
Householder Income Under 25 years Comparison
Scotch-Irish
Slovaks
$49,039
HOUSEHOLDER INCOME UNDER 25 YEARS
0.0/ 100
METRIC RATING
285th/ 347
METRIC RANK
$49,753
HOUSEHOLDER INCOME UNDER 25 YEARS
0.3/ 100
METRIC RATING
273rd/ 347
METRIC RANK
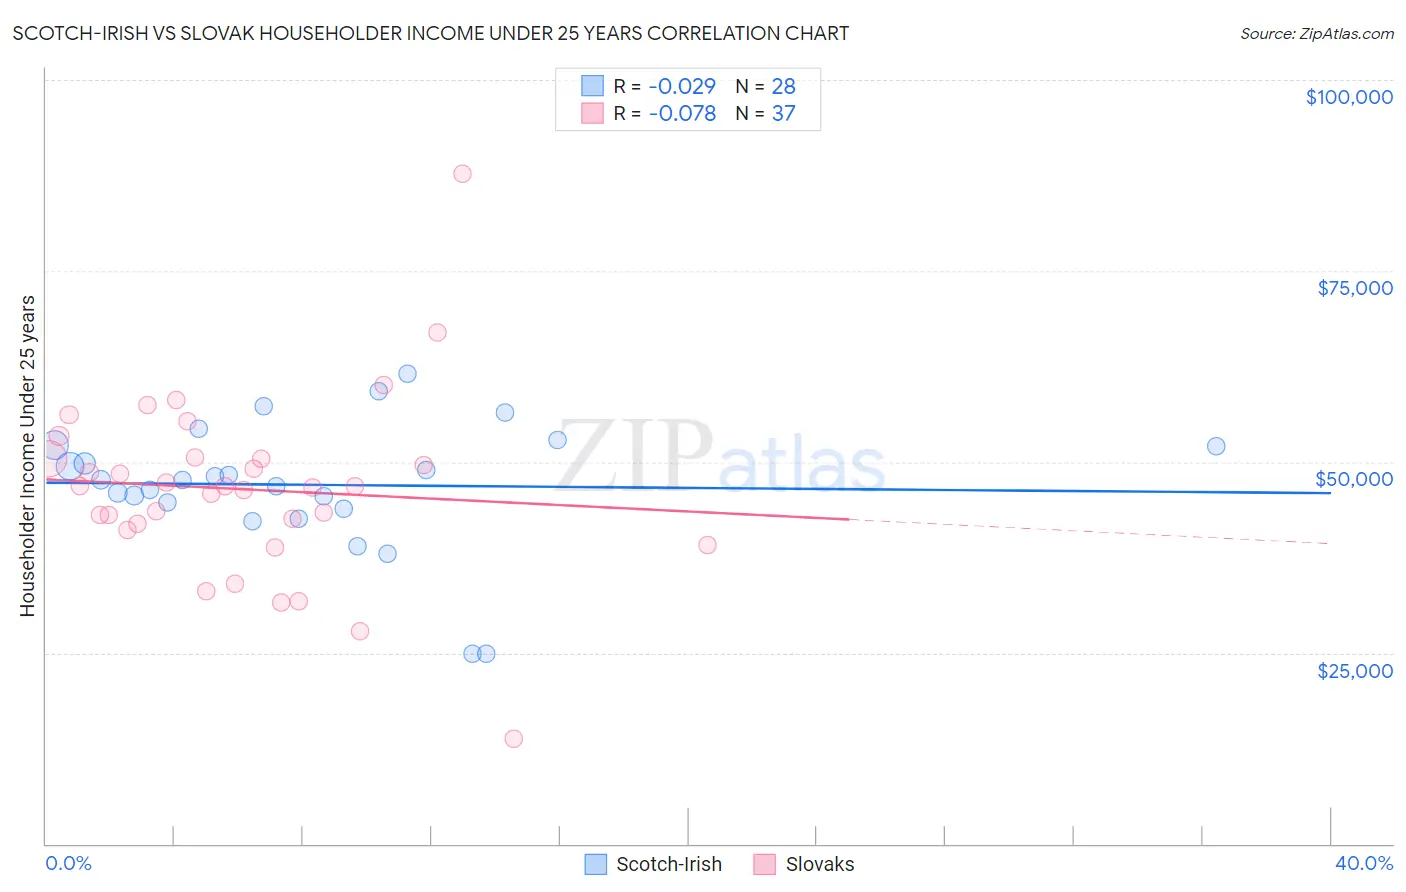
Scotch-Irish vs Slovak Householder Income Under 25 years Correlation Chart
The statistical analysis conducted on geographies consisting of 427,674,236 people shows no correlation between the proportion of Scotch-Irish and household income with householder under the age of 25 in the United States with a correlation coefficient (R) of -0.029 and weighted average of $49,039. Similarly, the statistical analysis conducted on geographies consisting of 328,630,657 people shows a slight negative correlation between the proportion of Slovaks and household income with householder under the age of 25 in the United States with a correlation coefficient (R) of -0.078 and weighted average of $49,753, a difference of 1.5%.
Householder Income Under 25 years Correlation Summary
| Measurement | Scotch-Irish | Slovak |
| Minimum | $24,821 | $13,750 |
| Maximum | $61,601 | $87,793 |
| Range | $36,780 | $74,043 |
| Mean | $47,004 | $46,421 |
| Median | $47,645 | $46,765 |
| Interquartile 25% (IQ1) | $44,331 | $41,531 |
| Interquartile 75% (IQ3) | $52,103 | $50,443 |
| Interquartile Range (IQR) | $7,772 | $8,912 |
| Standard Deviation (Sample) | $8,411 | $12,103 |
| Standard Deviation (Population) | $8,259 | $11,938 |
Demographics Similar to Scotch-Irish and Slovaks by Householder Income Under 25 years
In terms of householder income under 25 years, the demographic groups most similar to Scotch-Irish are French American Indian ($48,977, a difference of 0.13%), Carpatho Rusyn ($49,113, a difference of 0.15%), Senegalese ($48,953, a difference of 0.18%), Liberian ($48,917, a difference of 0.25%), and Immigrants from Nigeria ($49,174, a difference of 0.28%). Similarly, the demographic groups most similar to Slovaks are Immigrants from Senegal ($49,742, a difference of 0.020%), Colville ($49,774, a difference of 0.040%), Taiwanese ($49,804, a difference of 0.10%), Immigrants from Kenya ($49,633, a difference of 0.24%), and Dominican ($49,633, a difference of 0.24%).
| Demographics | Rating | Rank | Householder Income Under 25 years |
| Ute | 0.5 /100 | #269 | Tragic $49,997 |
| Mexicans | 0.5 /100 | #270 | Tragic $49,989 |
| Taiwanese | 0.3 /100 | #271 | Tragic $49,804 |
| Colville | 0.3 /100 | #272 | Tragic $49,774 |
| Slovaks | 0.3 /100 | #273 | Tragic $49,753 |
| Immigrants | Senegal | 0.3 /100 | #274 | Tragic $49,742 |
| Immigrants | Kenya | 0.2 /100 | #275 | Tragic $49,633 |
| Dominicans | 0.2 /100 | #276 | Tragic $49,633 |
| Immigrants | Western Africa | 0.2 /100 | #277 | Tragic $49,621 |
| Nigerians | 0.1 /100 | #278 | Tragic $49,416 |
| Apache | 0.1 /100 | #279 | Tragic $49,395 |
| Hmong | 0.1 /100 | #280 | Tragic $49,364 |
| Immigrants | Nonimmigrants | 0.1 /100 | #281 | Tragic $49,348 |
| Alsatians | 0.1 /100 | #282 | Tragic $49,267 |
| Immigrants | Nigeria | 0.1 /100 | #283 | Tragic $49,174 |
| Carpatho Rusyns | 0.1 /100 | #284 | Tragic $49,113 |
| Scotch-Irish | 0.0 /100 | #285 | Tragic $49,039 |
| French American Indians | 0.0 /100 | #286 | Tragic $48,977 |
| Senegalese | 0.0 /100 | #287 | Tragic $48,953 |
| Liberians | 0.0 /100 | #288 | Tragic $48,917 |
| Hondurans | 0.0 /100 | #289 | Tragic $48,885 |