Scotch-Irish vs Indian (Asian) Householder Income Under 25 years
COMPARE
Scotch-Irish
Indian (Asian)
Householder Income Under 25 years
Householder Income Under 25 years Comparison
Scotch-Irish
Indians (Asian)
$49,039
HOUSEHOLDER INCOME UNDER 25 YEARS
0.0/ 100
METRIC RATING
285th/ 347
METRIC RANK
$58,239
HOUSEHOLDER INCOME UNDER 25 YEARS
100.0/ 100
METRIC RATING
8th/ 347
METRIC RANK
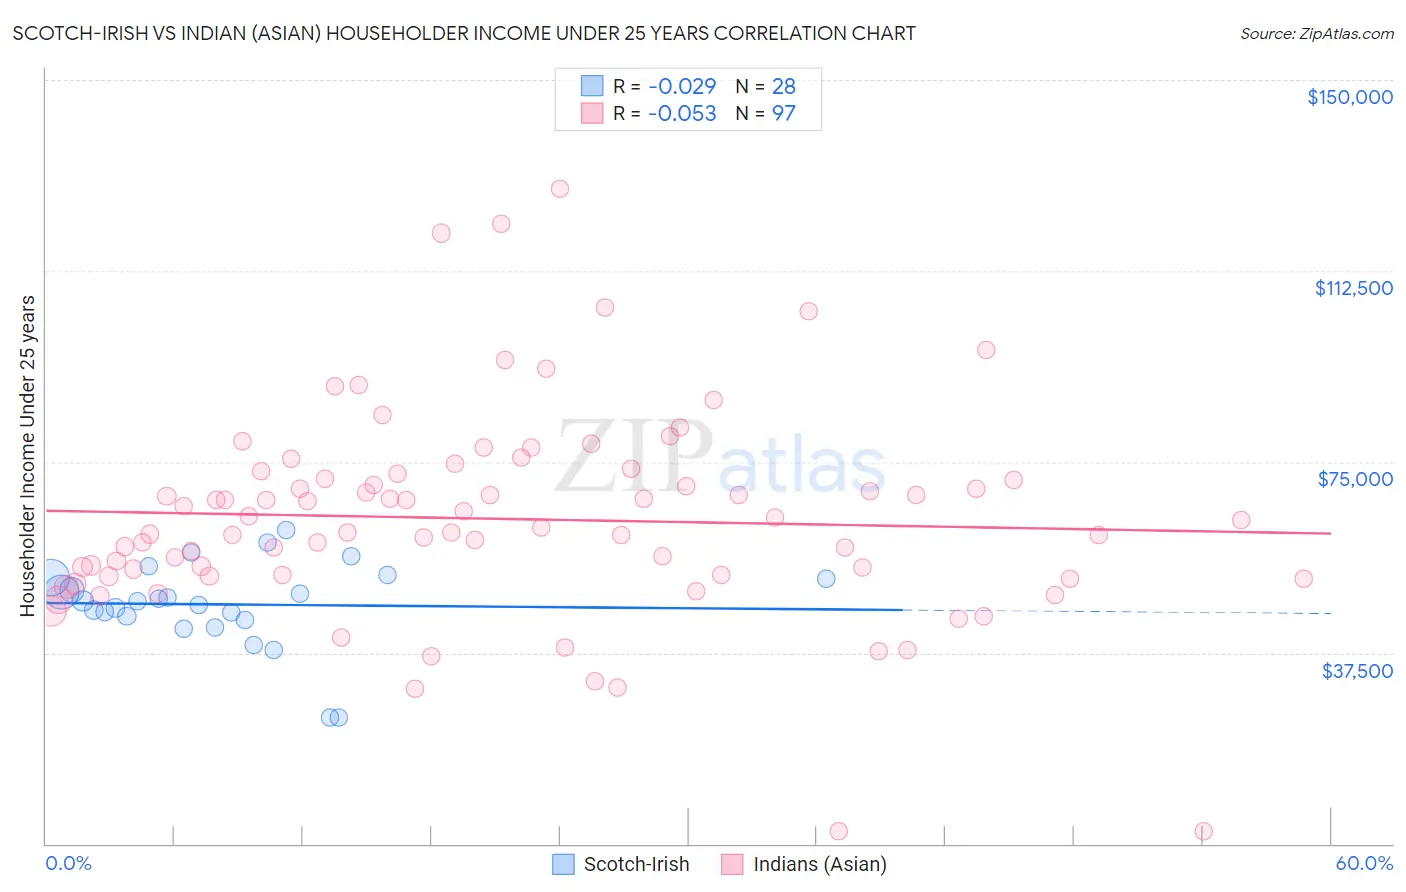
Scotch-Irish vs Indian (Asian) Householder Income Under 25 years Correlation Chart
The statistical analysis conducted on geographies consisting of 427,674,236 people shows no correlation between the proportion of Scotch-Irish and household income with householder under the age of 25 in the United States with a correlation coefficient (R) of -0.029 and weighted average of $49,039. Similarly, the statistical analysis conducted on geographies consisting of 402,539,075 people shows a slight negative correlation between the proportion of Indians (Asian) and household income with householder under the age of 25 in the United States with a correlation coefficient (R) of -0.053 and weighted average of $58,239, a difference of 18.8%.
Householder Income Under 25 years Correlation Summary
| Measurement | Scotch-Irish | Indian (Asian) |
| Minimum | $24,821 | $2,499 |
| Maximum | $61,601 | $128,558 |
| Range | $36,780 | $126,059 |
| Mean | $47,004 | $63,818 |
| Median | $47,645 | $62,127 |
| Interquartile 25% (IQ1) | $44,331 | $52,606 |
| Interquartile 75% (IQ3) | $52,103 | $72,136 |
| Interquartile Range (IQR) | $7,772 | $19,530 |
| Standard Deviation (Sample) | $8,411 | $20,459 |
| Standard Deviation (Population) | $8,259 | $20,353 |
Similar Demographics by Householder Income Under 25 years
Demographics Similar to Scotch-Irish by Householder Income Under 25 years
In terms of householder income under 25 years, the demographic groups most similar to Scotch-Irish are French American Indian ($48,977, a difference of 0.13%), Carpatho Rusyn ($49,113, a difference of 0.15%), Senegalese ($48,953, a difference of 0.18%), Liberian ($48,917, a difference of 0.25%), and Immigrants from Nigeria ($49,174, a difference of 0.28%).
| Demographics | Rating | Rank | Householder Income Under 25 years |
| Nigerians | 0.1 /100 | #278 | Tragic $49,416 |
| Apache | 0.1 /100 | #279 | Tragic $49,395 |
| Hmong | 0.1 /100 | #280 | Tragic $49,364 |
| Immigrants | Nonimmigrants | 0.1 /100 | #281 | Tragic $49,348 |
| Alsatians | 0.1 /100 | #282 | Tragic $49,267 |
| Immigrants | Nigeria | 0.1 /100 | #283 | Tragic $49,174 |
| Carpatho Rusyns | 0.1 /100 | #284 | Tragic $49,113 |
| Scotch-Irish | 0.0 /100 | #285 | Tragic $49,039 |
| French American Indians | 0.0 /100 | #286 | Tragic $48,977 |
| Senegalese | 0.0 /100 | #287 | Tragic $48,953 |
| Liberians | 0.0 /100 | #288 | Tragic $48,917 |
| Hondurans | 0.0 /100 | #289 | Tragic $48,885 |
| Americans | 0.0 /100 | #290 | Tragic $48,860 |
| Immigrants | Burma/Myanmar | 0.0 /100 | #291 | Tragic $48,749 |
| Shoshone | 0.0 /100 | #292 | Tragic $48,720 |
Demographics Similar to Indians (Asian) by Householder Income Under 25 years
In terms of householder income under 25 years, the demographic groups most similar to Indians (Asian) are Chinese ($58,162, a difference of 0.13%), Afghan ($58,019, a difference of 0.38%), Bolivian ($58,506, a difference of 0.46%), Immigrants from China ($57,931, a difference of 0.53%), and Immigrants from Philippines ($57,930, a difference of 0.53%).
| Demographics | Rating | Rank | Householder Income Under 25 years |
| Assyrians/Chaldeans/Syriacs | 100.0 /100 | #1 | Exceptional $65,329 |
| Immigrants | Hong Kong | 100.0 /100 | #2 | Exceptional $62,083 |
| Immigrants | India | 100.0 /100 | #3 | Exceptional $59,914 |
| Immigrants | Taiwan | 100.0 /100 | #4 | Exceptional $59,424 |
| Immigrants | Bolivia | 100.0 /100 | #5 | Exceptional $59,389 |
| Thais | 100.0 /100 | #6 | Exceptional $59,187 |
| Bolivians | 100.0 /100 | #7 | Exceptional $58,506 |
| Indians (Asian) | 100.0 /100 | #8 | Exceptional $58,239 |
| Chinese | 100.0 /100 | #9 | Exceptional $58,162 |
| Afghans | 100.0 /100 | #10 | Exceptional $58,019 |
| Immigrants | China | 100.0 /100 | #11 | Exceptional $57,931 |
| Immigrants | Philippines | 100.0 /100 | #12 | Exceptional $57,930 |
| Immigrants | South Central Asia | 100.0 /100 | #13 | Exceptional $57,818 |
| Filipinos | 100.0 /100 | #14 | Exceptional $57,740 |
| Koreans | 100.0 /100 | #15 | Exceptional $57,730 |