Pueblo vs Macedonian Median Female Earnings
COMPARE
Pueblo
Macedonian
Median Female Earnings
Median Female Earnings Comparison
Pueblo
Macedonians
$32,564
MEDIAN FEMALE EARNINGS
0.0/ 100
METRIC RATING
343rd/ 347
METRIC RANK
$41,286
MEDIAN FEMALE EARNINGS
96.4/ 100
METRIC RATING
113th/ 347
METRIC RANK
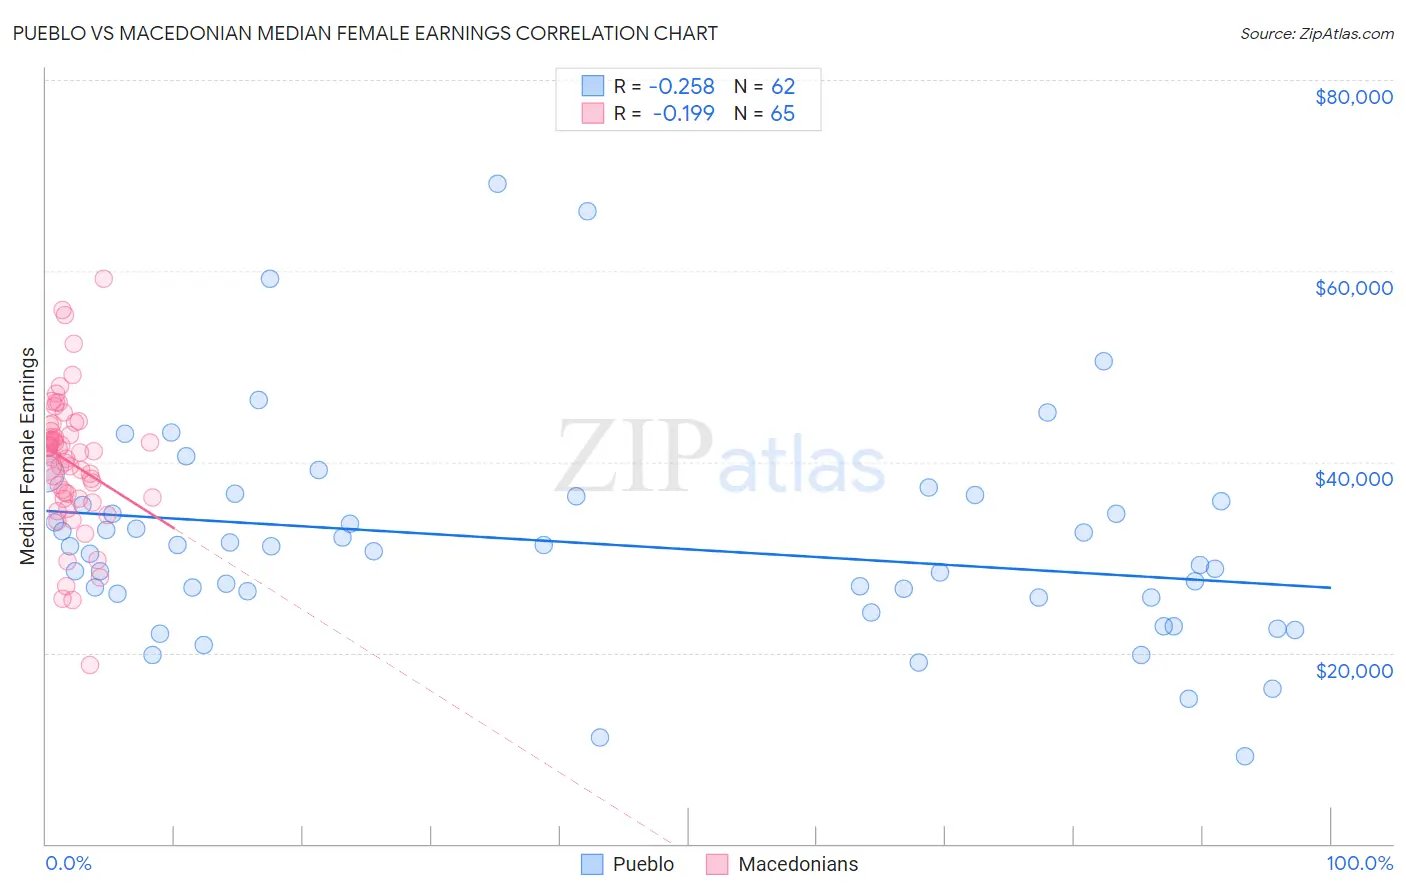
Pueblo vs Macedonian Median Female Earnings Correlation Chart
The statistical analysis conducted on geographies consisting of 120,036,612 people shows a weak negative correlation between the proportion of Pueblo and median female earnings in the United States with a correlation coefficient (R) of -0.258 and weighted average of $32,564. Similarly, the statistical analysis conducted on geographies consisting of 132,580,469 people shows a poor negative correlation between the proportion of Macedonians and median female earnings in the United States with a correlation coefficient (R) of -0.199 and weighted average of $41,286, a difference of 26.8%.
Median Female Earnings Correlation Summary
| Measurement | Pueblo | Macedonian |
| Minimum | $9,219 | $18,750 |
| Maximum | $69,074 | $59,207 |
| Range | $59,855 | $40,457 |
| Mean | $31,512 | $39,979 |
| Median | $30,863 | $40,874 |
| Interquartile 25% (IQ1) | $25,792 | $36,195 |
| Interquartile 75% (IQ3) | $35,833 | $43,538 |
| Interquartile Range (IQR) | $10,041 | $7,343 |
| Standard Deviation (Sample) | $11,084 | $7,121 |
| Standard Deviation (Population) | $10,994 | $7,066 |
Similar Demographics by Median Female Earnings
Demographics Similar to Pueblo by Median Female Earnings
In terms of median female earnings, the demographic groups most similar to Pueblo are Lumbee ($32,500, a difference of 0.20%), Yup'ik ($32,730, a difference of 0.51%), Navajo ($33,046, a difference of 1.5%), Tohono O'odham ($33,205, a difference of 2.0%), and Immigrants from Mexico ($33,236, a difference of 2.1%).
| Demographics | Rating | Rank | Median Female Earnings |
| Mexicans | 0.0 /100 | #333 | Tragic $33,664 |
| Spanish American Indians | 0.0 /100 | #334 | Tragic $33,625 |
| Creek | 0.0 /100 | #335 | Tragic $33,437 |
| Ottawa | 0.0 /100 | #336 | Tragic $33,378 |
| Yakama | 0.0 /100 | #337 | Tragic $33,354 |
| Immigrants | Cuba | 0.0 /100 | #338 | Tragic $33,291 |
| Immigrants | Mexico | 0.0 /100 | #339 | Tragic $33,236 |
| Tohono O'odham | 0.0 /100 | #340 | Tragic $33,205 |
| Navajo | 0.0 /100 | #341 | Tragic $33,046 |
| Yup'ik | 0.0 /100 | #342 | Tragic $32,730 |
| Pueblo | 0.0 /100 | #343 | Tragic $32,564 |
| Lumbee | 0.0 /100 | #344 | Tragic $32,500 |
| Puerto Ricans | 0.0 /100 | #345 | Tragic $31,560 |
| Arapaho | 0.0 /100 | #346 | Tragic $31,489 |
| Houma | 0.0 /100 | #347 | Tragic $30,343 |
Demographics Similar to Macedonians by Median Female Earnings
In terms of median female earnings, the demographic groups most similar to Macedonians are Immigrants from England ($41,277, a difference of 0.020%), Korean ($41,276, a difference of 0.020%), Immigrants from Brazil ($41,273, a difference of 0.030%), Barbadian ($41,261, a difference of 0.060%), and Immigrants from North America ($41,319, a difference of 0.080%).
| Demographics | Rating | Rank | Median Female Earnings |
| Immigrants | Eritrea | 97.6 /100 | #106 | Exceptional $41,485 |
| Palestinians | 97.6 /100 | #107 | Exceptional $41,484 |
| Jordanians | 97.5 /100 | #108 | Exceptional $41,464 |
| Chinese | 97.5 /100 | #109 | Exceptional $41,461 |
| Immigrants | Western Asia | 97.0 /100 | #110 | Exceptional $41,375 |
| Immigrants | Canada | 97.0 /100 | #111 | Exceptional $41,373 |
| Immigrants | North America | 96.7 /100 | #112 | Exceptional $41,319 |
| Macedonians | 96.4 /100 | #113 | Exceptional $41,286 |
| Immigrants | England | 96.4 /100 | #114 | Exceptional $41,277 |
| Koreans | 96.4 /100 | #115 | Exceptional $41,276 |
| Immigrants | Brazil | 96.4 /100 | #116 | Exceptional $41,273 |
| Barbadians | 96.3 /100 | #117 | Exceptional $41,261 |
| Immigrants | Lebanon | 95.6 /100 | #118 | Exceptional $41,183 |
| Immigrants | Philippines | 95.0 /100 | #119 | Exceptional $41,114 |
| Immigrants | Kuwait | 94.4 /100 | #120 | Exceptional $41,055 |