Scotch-Irish vs Macedonian Family Households
COMPARE
Scotch-Irish
Macedonian
Family Households
Family Households Comparison
Scotch-Irish
Macedonians
64.4%
FAMILY HOUSEHOLDS
59.2/ 100
METRIC RATING
166th/ 347
METRIC RANK
63.7%
FAMILY HOUSEHOLDS
6.5/ 100
METRIC RATING
219th/ 347
METRIC RANK
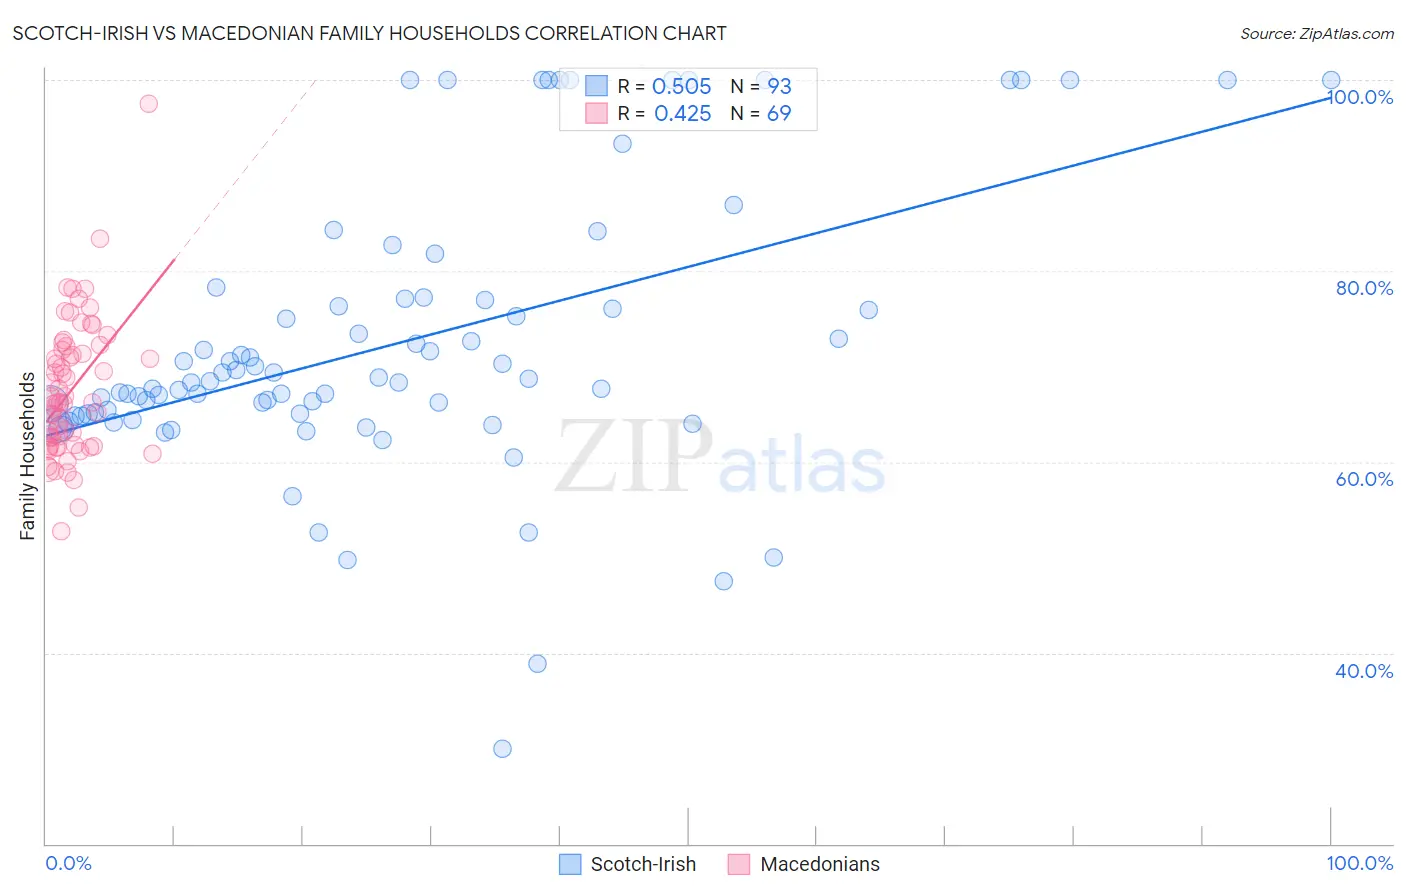
Scotch-Irish vs Macedonian Family Households Correlation Chart
The statistical analysis conducted on geographies consisting of 548,372,963 people shows a substantial positive correlation between the proportion of Scotch-Irish and percentage of family households in the United States with a correlation coefficient (R) of 0.505 and weighted average of 64.4%. Similarly, the statistical analysis conducted on geographies consisting of 132,622,141 people shows a moderate positive correlation between the proportion of Macedonians and percentage of family households in the United States with a correlation coefficient (R) of 0.425 and weighted average of 63.7%, a difference of 1.0%.
Family Households Correlation Summary
| Measurement | Scotch-Irish | Macedonian |
| Minimum | 29.9% | 52.7% |
| Maximum | 100.0% | 97.6% |
| Range | 70.1% | 44.8% |
| Mean | 72.5% | 67.5% |
| Median | 68.4% | 66.2% |
| Interquartile 25% (IQ1) | 64.9% | 61.7% |
| Interquartile 75% (IQ3) | 77.0% | 72.0% |
| Interquartile Range (IQR) | 12.1% | 10.2% |
| Standard Deviation (Sample) | 14.6% | 7.2% |
| Standard Deviation (Population) | 14.5% | 7.2% |
Similar Demographics by Family Households
Demographics Similar to Scotch-Irish by Family Households
In terms of family households, the demographic groups most similar to Scotch-Irish are Immigrants from Nigeria (64.4%, a difference of 0.010%), Immigrants from Southern Europe (64.4%, a difference of 0.010%), Irish (64.4%, a difference of 0.020%), Honduran (64.4%, a difference of 0.020%), and British (64.4%, a difference of 0.030%).
| Demographics | Rating | Rank | Family Households |
| Germans | 65.8 /100 | #159 | Good 64.4% |
| Immigrants | Moldova | 65.2 /100 | #160 | Good 64.4% |
| Immigrants | England | 62.6 /100 | #161 | Good 64.4% |
| British | 61.6 /100 | #162 | Good 64.4% |
| Chickasaw | 61.5 /100 | #163 | Good 64.4% |
| Immigrants | Nigeria | 60.1 /100 | #164 | Good 64.4% |
| Immigrants | Southern Europe | 60.0 /100 | #165 | Good 64.4% |
| Scotch-Irish | 59.2 /100 | #166 | Average 64.4% |
| Irish | 57.9 /100 | #167 | Average 64.4% |
| Hondurans | 57.5 /100 | #168 | Average 64.4% |
| Iraqis | 56.0 /100 | #169 | Average 64.4% |
| Armenians | 55.9 /100 | #170 | Average 64.4% |
| Ute | 54.6 /100 | #171 | Average 64.3% |
| Dutch West Indians | 53.9 /100 | #172 | Average 64.3% |
| Immigrants | Sierra Leone | 52.5 /100 | #173 | Average 64.3% |
Demographics Similar to Macedonians by Family Households
In terms of family households, the demographic groups most similar to Macedonians are Immigrants from Europe (63.7%, a difference of 0.010%), Osage (63.7%, a difference of 0.030%), Marshallese (63.7%, a difference of 0.030%), Immigrants from South Africa (63.7%, a difference of 0.030%), and Croatian (63.8%, a difference of 0.040%).
| Demographics | Rating | Rank | Family Households |
| Immigrants | Netherlands | 9.4 /100 | #212 | Tragic 63.8% |
| Immigrants | Northern Europe | 8.8 /100 | #213 | Tragic 63.8% |
| Celtics | 8.0 /100 | #214 | Tragic 63.8% |
| Belgians | 7.6 /100 | #215 | Tragic 63.8% |
| Croatians | 7.3 /100 | #216 | Tragic 63.8% |
| Osage | 7.0 /100 | #217 | Tragic 63.7% |
| Marshallese | 6.9 /100 | #218 | Tragic 63.7% |
| Macedonians | 6.5 /100 | #219 | Tragic 63.7% |
| Immigrants | Europe | 6.4 /100 | #220 | Tragic 63.7% |
| Immigrants | South Africa | 5.9 /100 | #221 | Tragic 63.7% |
| Immigrants | Belarus | 5.5 /100 | #222 | Tragic 63.7% |
| French Canadians | 5.4 /100 | #223 | Tragic 63.7% |
| Turks | 4.5 /100 | #224 | Tragic 63.6% |
| Immigrants | Hungary | 4.3 /100 | #225 | Tragic 63.6% |
| Immigrants | Bahamas | 4.2 /100 | #226 | Tragic 63.6% |