Immigrants from Barbados vs Macedonian Median Female Earnings
COMPARE
Immigrants from Barbados
Macedonian
Median Female Earnings
Median Female Earnings Comparison
Immigrants from Barbados
Macedonians
$41,685
MEDIAN FEMALE EARNINGS
98.4/ 100
METRIC RATING
99th/ 347
METRIC RANK
$41,286
MEDIAN FEMALE EARNINGS
96.4/ 100
METRIC RATING
113th/ 347
METRIC RANK
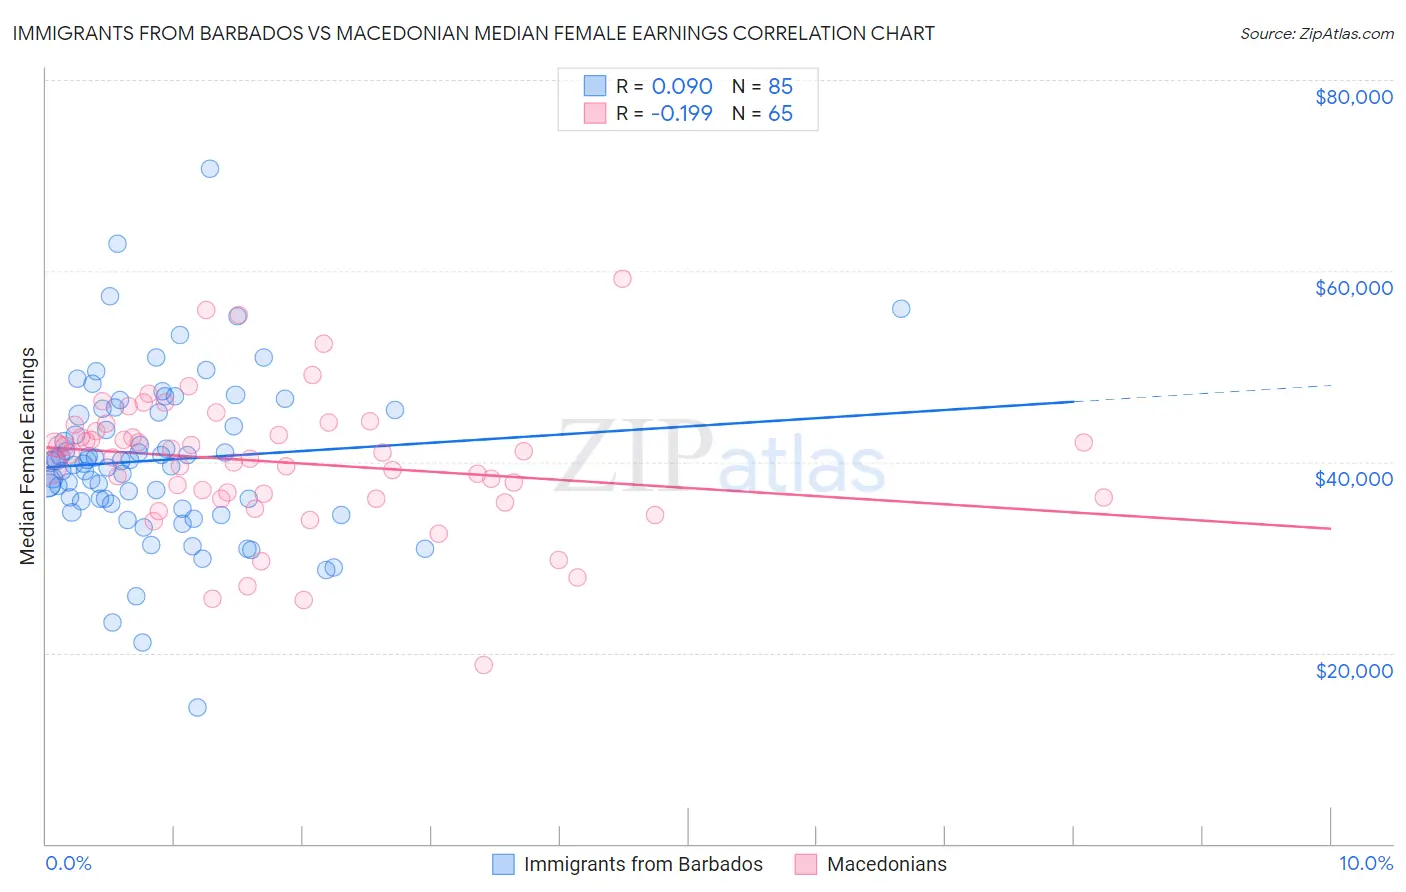
Immigrants from Barbados vs Macedonian Median Female Earnings Correlation Chart
The statistical analysis conducted on geographies consisting of 112,771,231 people shows a slight positive correlation between the proportion of Immigrants from Barbados and median female earnings in the United States with a correlation coefficient (R) of 0.090 and weighted average of $41,685. Similarly, the statistical analysis conducted on geographies consisting of 132,580,469 people shows a poor negative correlation between the proportion of Macedonians and median female earnings in the United States with a correlation coefficient (R) of -0.199 and weighted average of $41,286, a difference of 0.97%.
Median Female Earnings Correlation Summary
| Measurement | Immigrants from Barbados | Macedonian |
| Minimum | $14,324 | $18,750 |
| Maximum | $70,712 | $59,207 |
| Range | $56,388 | $40,457 |
| Mean | $40,171 | $39,979 |
| Median | $40,011 | $40,874 |
| Interquartile 25% (IQ1) | $35,731 | $36,195 |
| Interquartile 75% (IQ3) | $45,302 | $43,538 |
| Interquartile Range (IQR) | $9,570 | $7,343 |
| Standard Deviation (Sample) | $8,566 | $7,121 |
| Standard Deviation (Population) | $8,515 | $7,066 |
Demographics Similar to Immigrants from Barbados and Macedonians by Median Female Earnings
In terms of median female earnings, the demographic groups most similar to Immigrants from Barbados are Romanian ($41,663, a difference of 0.050%), Immigrants from Fiji ($41,656, a difference of 0.070%), Immigrants from Poland ($41,630, a difference of 0.13%), Immigrants from Scotland ($41,771, a difference of 0.21%), and Immigrants from Argentina ($41,554, a difference of 0.31%). Similarly, the demographic groups most similar to Macedonians are Immigrants from England ($41,277, a difference of 0.020%), Korean ($41,276, a difference of 0.020%), Immigrants from Brazil ($41,273, a difference of 0.030%), Immigrants from North America ($41,319, a difference of 0.080%), and Immigrants from Canada ($41,373, a difference of 0.21%).
| Demographics | Rating | Rank | Median Female Earnings |
| South Africans | 98.8 /100 | #96 | Exceptional $41,825 |
| Immigrants | Hungary | 98.8 /100 | #97 | Exceptional $41,820 |
| Immigrants | Scotland | 98.7 /100 | #98 | Exceptional $41,771 |
| Immigrants | Barbados | 98.4 /100 | #99 | Exceptional $41,685 |
| Romanians | 98.3 /100 | #100 | Exceptional $41,663 |
| Immigrants | Fiji | 98.3 /100 | #101 | Exceptional $41,656 |
| Immigrants | Poland | 98.2 /100 | #102 | Exceptional $41,630 |
| Immigrants | Argentina | 97.9 /100 | #103 | Exceptional $41,554 |
| Immigrants | Zimbabwe | 97.8 /100 | #104 | Exceptional $41,527 |
| Italians | 97.7 /100 | #105 | Exceptional $41,505 |
| Immigrants | Eritrea | 97.6 /100 | #106 | Exceptional $41,485 |
| Palestinians | 97.6 /100 | #107 | Exceptional $41,484 |
| Jordanians | 97.5 /100 | #108 | Exceptional $41,464 |
| Chinese | 97.5 /100 | #109 | Exceptional $41,461 |
| Immigrants | Western Asia | 97.0 /100 | #110 | Exceptional $41,375 |
| Immigrants | Canada | 97.0 /100 | #111 | Exceptional $41,373 |
| Immigrants | North America | 96.7 /100 | #112 | Exceptional $41,319 |
| Macedonians | 96.4 /100 | #113 | Exceptional $41,286 |
| Immigrants | England | 96.4 /100 | #114 | Exceptional $41,277 |
| Koreans | 96.4 /100 | #115 | Exceptional $41,276 |
| Immigrants | Brazil | 96.4 /100 | #116 | Exceptional $41,273 |