Scotch-Irish vs Macedonian 10th Grade
COMPARE
Scotch-Irish
Macedonian
10th Grade
10th Grade Comparison
Scotch-Irish
Macedonians
95.2%
10TH GRADE
99.9/ 100
METRIC RATING
40th/ 347
METRIC RANK
95.2%
10TH GRADE
99.9/ 100
METRIC RATING
43rd/ 347
METRIC RANK
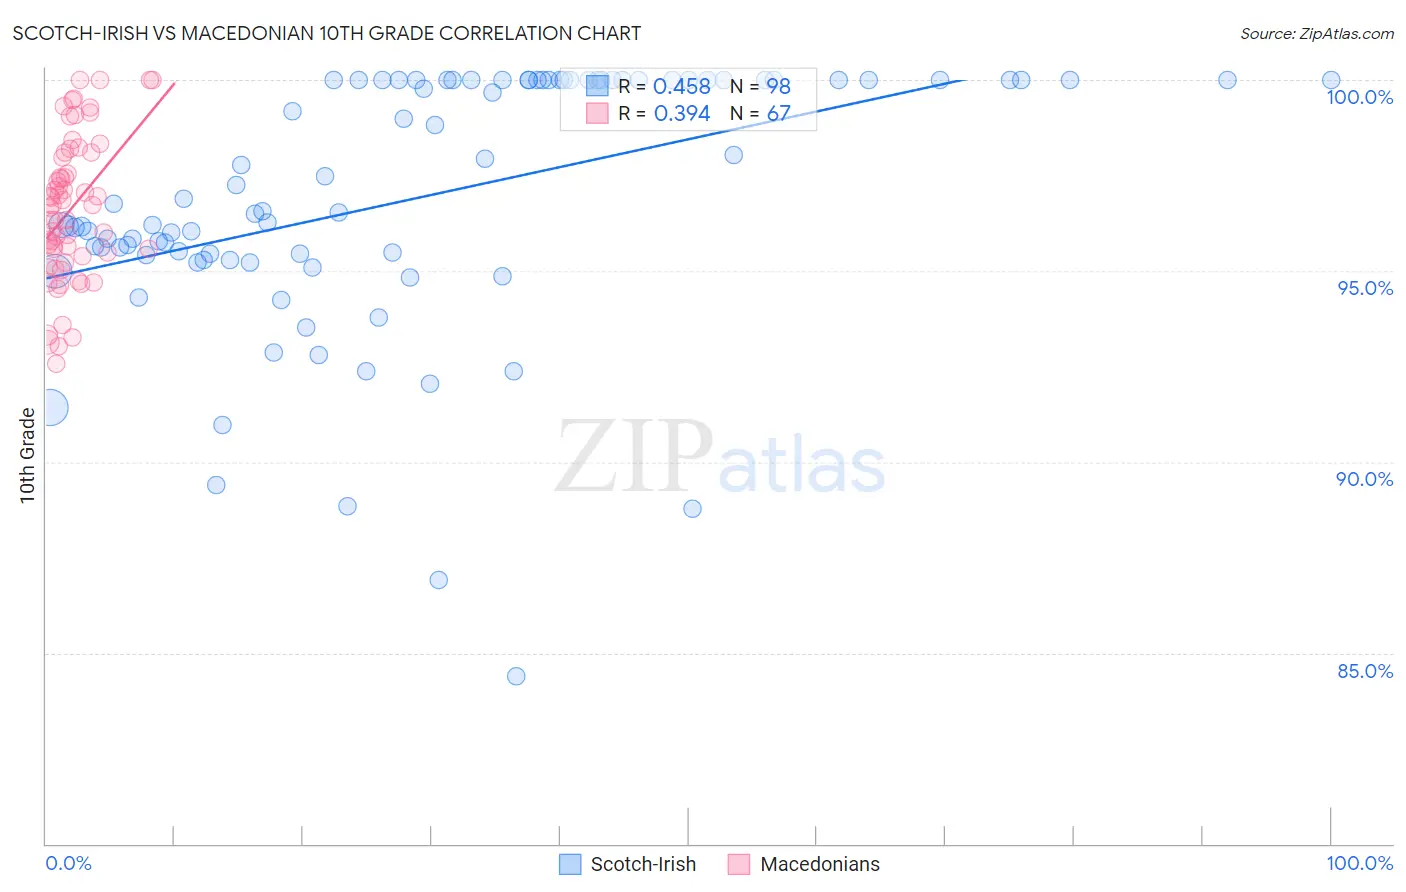
Scotch-Irish vs Macedonian 10th Grade Correlation Chart
The statistical analysis conducted on geographies consisting of 548,777,546 people shows a moderate positive correlation between the proportion of Scotch-Irish and percentage of population with at least 10th grade education in the United States with a correlation coefficient (R) of 0.458 and weighted average of 95.2%. Similarly, the statistical analysis conducted on geographies consisting of 132,581,663 people shows a mild positive correlation between the proportion of Macedonians and percentage of population with at least 10th grade education in the United States with a correlation coefficient (R) of 0.394 and weighted average of 95.2%, a difference of 0.080%.
10th Grade Correlation Summary
| Measurement | Scotch-Irish | Macedonian |
| Minimum | 84.4% | 92.6% |
| Maximum | 100.0% | 100.0% |
| Range | 15.6% | 7.4% |
| Mean | 96.9% | 96.6% |
| Median | 96.7% | 96.7% |
| Interquartile 25% (IQ1) | 95.4% | 95.4% |
| Interquartile 75% (IQ3) | 100.0% | 98.1% |
| Interquartile Range (IQR) | 4.6% | 2.7% |
| Standard Deviation (Sample) | 3.3% | 1.9% |
| Standard Deviation (Population) | 3.3% | 1.9% |
Demographics Similar to Scotch-Irish and Macedonians by 10th Grade
In terms of 10th grade, the demographic groups most similar to Scotch-Irish are Immigrants from Scotland (95.2%, a difference of 0.0%), Russian (95.2%, a difference of 0.020%), Northern European (95.3%, a difference of 0.030%), French Canadian (95.3%, a difference of 0.060%), and Slavic (95.2%, a difference of 0.060%). Similarly, the demographic groups most similar to Macedonians are Immigrants from Northern Europe (95.2%, a difference of 0.010%), Greek (95.2%, a difference of 0.010%), Slavic (95.2%, a difference of 0.020%), Czechoslovakian (95.1%, a difference of 0.020%), and Serbian (95.1%, a difference of 0.030%).
| Demographics | Rating | Rank | 10th Grade |
| Iranians | 100.0 /100 | #31 | Exceptional 95.3% |
| Hungarians | 100.0 /100 | #32 | Exceptional 95.3% |
| French | 100.0 /100 | #33 | Exceptional 95.3% |
| British | 99.9 /100 | #34 | Exceptional 95.3% |
| Estonians | 99.9 /100 | #35 | Exceptional 95.3% |
| Immigrants | India | 99.9 /100 | #36 | Exceptional 95.3% |
| French Canadians | 99.9 /100 | #37 | Exceptional 95.3% |
| Northern Europeans | 99.9 /100 | #38 | Exceptional 95.3% |
| Immigrants | Scotland | 99.9 /100 | #39 | Exceptional 95.2% |
| Scotch-Irish | 99.9 /100 | #40 | Exceptional 95.2% |
| Russians | 99.9 /100 | #41 | Exceptional 95.2% |
| Slavs | 99.9 /100 | #42 | Exceptional 95.2% |
| Macedonians | 99.9 /100 | #43 | Exceptional 95.2% |
| Immigrants | Northern Europe | 99.9 /100 | #44 | Exceptional 95.2% |
| Greeks | 99.9 /100 | #45 | Exceptional 95.2% |
| Czechoslovakians | 99.9 /100 | #46 | Exceptional 95.1% |
| Serbians | 99.9 /100 | #47 | Exceptional 95.1% |
| Australians | 99.9 /100 | #48 | Exceptional 95.1% |
| Immigrants | Austria | 99.9 /100 | #49 | Exceptional 95.1% |
| Immigrants | Canada | 99.8 /100 | #50 | Exceptional 95.1% |
| Austrians | 99.8 /100 | #51 | Exceptional 95.1% |