Immigrants from England vs Macedonian Median Female Earnings
COMPARE
Immigrants from England
Macedonian
Median Female Earnings
Median Female Earnings Comparison
Immigrants from England
Macedonians
$41,277
MEDIAN FEMALE EARNINGS
96.4/ 100
METRIC RATING
114th/ 347
METRIC RANK
$41,286
MEDIAN FEMALE EARNINGS
96.4/ 100
METRIC RATING
113th/ 347
METRIC RANK
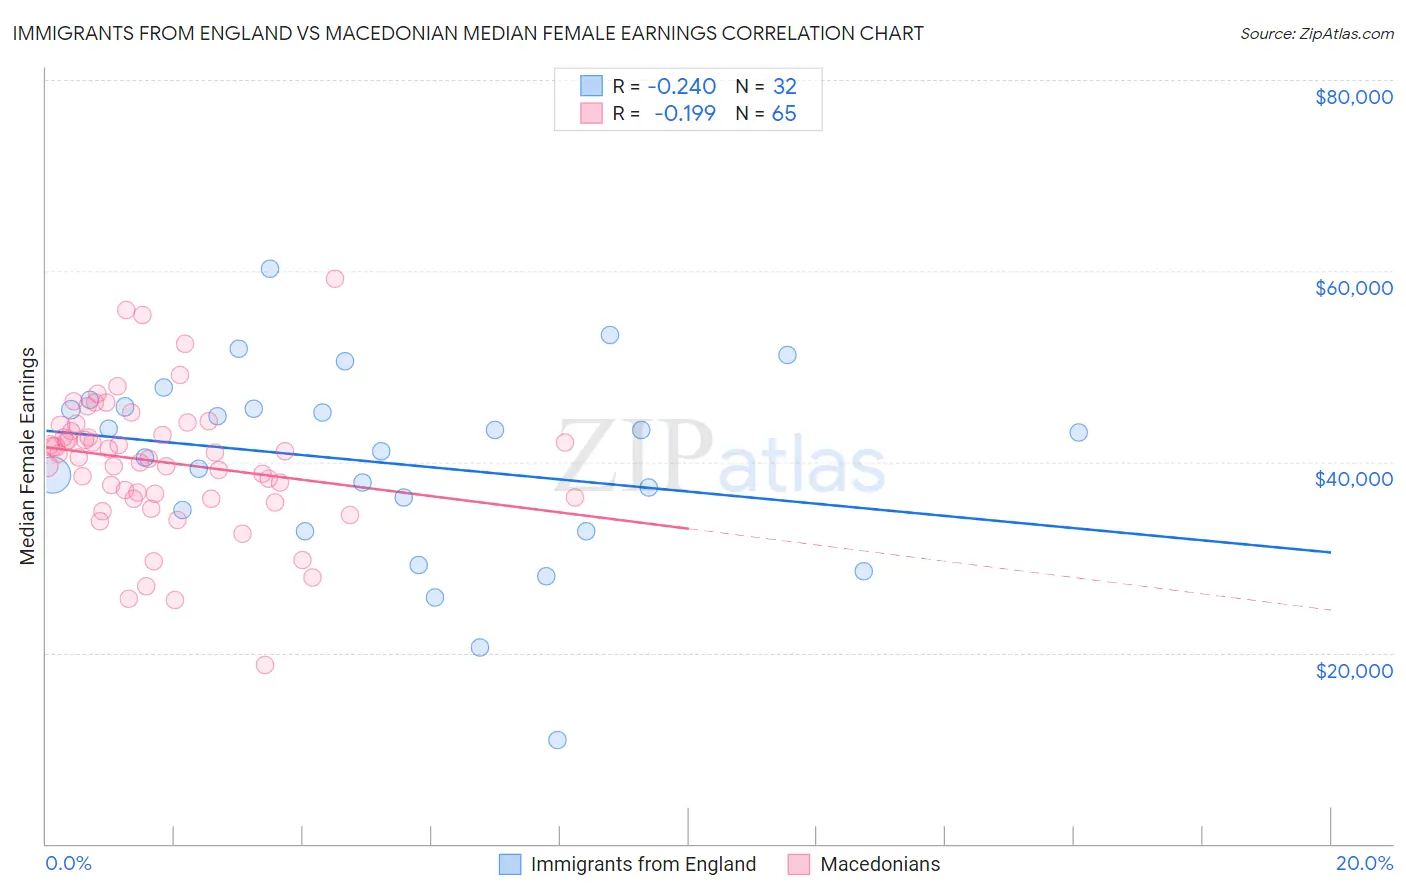
Immigrants from England vs Macedonian Median Female Earnings Correlation Chart
The statistical analysis conducted on geographies consisting of 391,639,302 people shows a weak negative correlation between the proportion of Immigrants from England and median female earnings in the United States with a correlation coefficient (R) of -0.240 and weighted average of $41,277. Similarly, the statistical analysis conducted on geographies consisting of 132,580,469 people shows a poor negative correlation between the proportion of Macedonians and median female earnings in the United States with a correlation coefficient (R) of -0.199 and weighted average of $41,286, a difference of 0.020%.
Median Female Earnings Correlation Summary
| Measurement | Immigrants from England | Macedonian |
| Minimum | $10,833 | $18,750 |
| Maximum | $60,183 | $59,207 |
| Range | $49,350 | $40,457 |
| Mean | $39,877 | $39,979 |
| Median | $42,129 | $40,874 |
| Interquartile 25% (IQ1) | $33,842 | $36,195 |
| Interquartile 75% (IQ3) | $45,694 | $43,538 |
| Interquartile Range (IQR) | $11,853 | $7,343 |
| Standard Deviation (Sample) | $10,217 | $7,121 |
| Standard Deviation (Population) | $10,056 | $7,066 |
Demographics Similar to Immigrants from England and Macedonians by Median Female Earnings
In terms of median female earnings, the demographic groups most similar to Immigrants from England are Korean ($41,276, a difference of 0.0%), Immigrants from Brazil ($41,273, a difference of 0.010%), Barbadian ($41,261, a difference of 0.040%), Immigrants from North America ($41,319, a difference of 0.10%), and Immigrants from Canada ($41,373, a difference of 0.23%). Similarly, the demographic groups most similar to Macedonians are Korean ($41,276, a difference of 0.020%), Immigrants from Brazil ($41,273, a difference of 0.030%), Barbadian ($41,261, a difference of 0.060%), Immigrants from North America ($41,319, a difference of 0.080%), and Immigrants from Canada ($41,373, a difference of 0.21%).
| Demographics | Rating | Rank | Median Female Earnings |
| Immigrants | Argentina | 97.9 /100 | #103 | Exceptional $41,554 |
| Immigrants | Zimbabwe | 97.8 /100 | #104 | Exceptional $41,527 |
| Italians | 97.7 /100 | #105 | Exceptional $41,505 |
| Immigrants | Eritrea | 97.6 /100 | #106 | Exceptional $41,485 |
| Palestinians | 97.6 /100 | #107 | Exceptional $41,484 |
| Jordanians | 97.5 /100 | #108 | Exceptional $41,464 |
| Chinese | 97.5 /100 | #109 | Exceptional $41,461 |
| Immigrants | Western Asia | 97.0 /100 | #110 | Exceptional $41,375 |
| Immigrants | Canada | 97.0 /100 | #111 | Exceptional $41,373 |
| Immigrants | North America | 96.7 /100 | #112 | Exceptional $41,319 |
| Macedonians | 96.4 /100 | #113 | Exceptional $41,286 |
| Immigrants | England | 96.4 /100 | #114 | Exceptional $41,277 |
| Koreans | 96.4 /100 | #115 | Exceptional $41,276 |
| Immigrants | Brazil | 96.4 /100 | #116 | Exceptional $41,273 |
| Barbadians | 96.3 /100 | #117 | Exceptional $41,261 |
| Immigrants | Lebanon | 95.6 /100 | #118 | Exceptional $41,183 |
| Immigrants | Philippines | 95.0 /100 | #119 | Exceptional $41,114 |
| Immigrants | Kuwait | 94.4 /100 | #120 | Exceptional $41,055 |
| Croatians | 93.7 /100 | #121 | Exceptional $40,993 |
| Immigrants | Jordan | 93.5 /100 | #122 | Exceptional $40,977 |
| Guyanese | 93.4 /100 | #123 | Exceptional $40,973 |