Danish vs Immigrants from South Africa Median Family Income
COMPARE
Danish
Immigrants from South Africa
Median Family Income
Median Family Income Comparison
Danes
Immigrants from South Africa
$105,900
MEDIAN FAMILY INCOME
83.8/ 100
METRIC RATING
145th/ 347
METRIC RANK
$116,286
MEDIAN FAMILY INCOME
99.9/ 100
METRIC RATING
48th/ 347
METRIC RANK
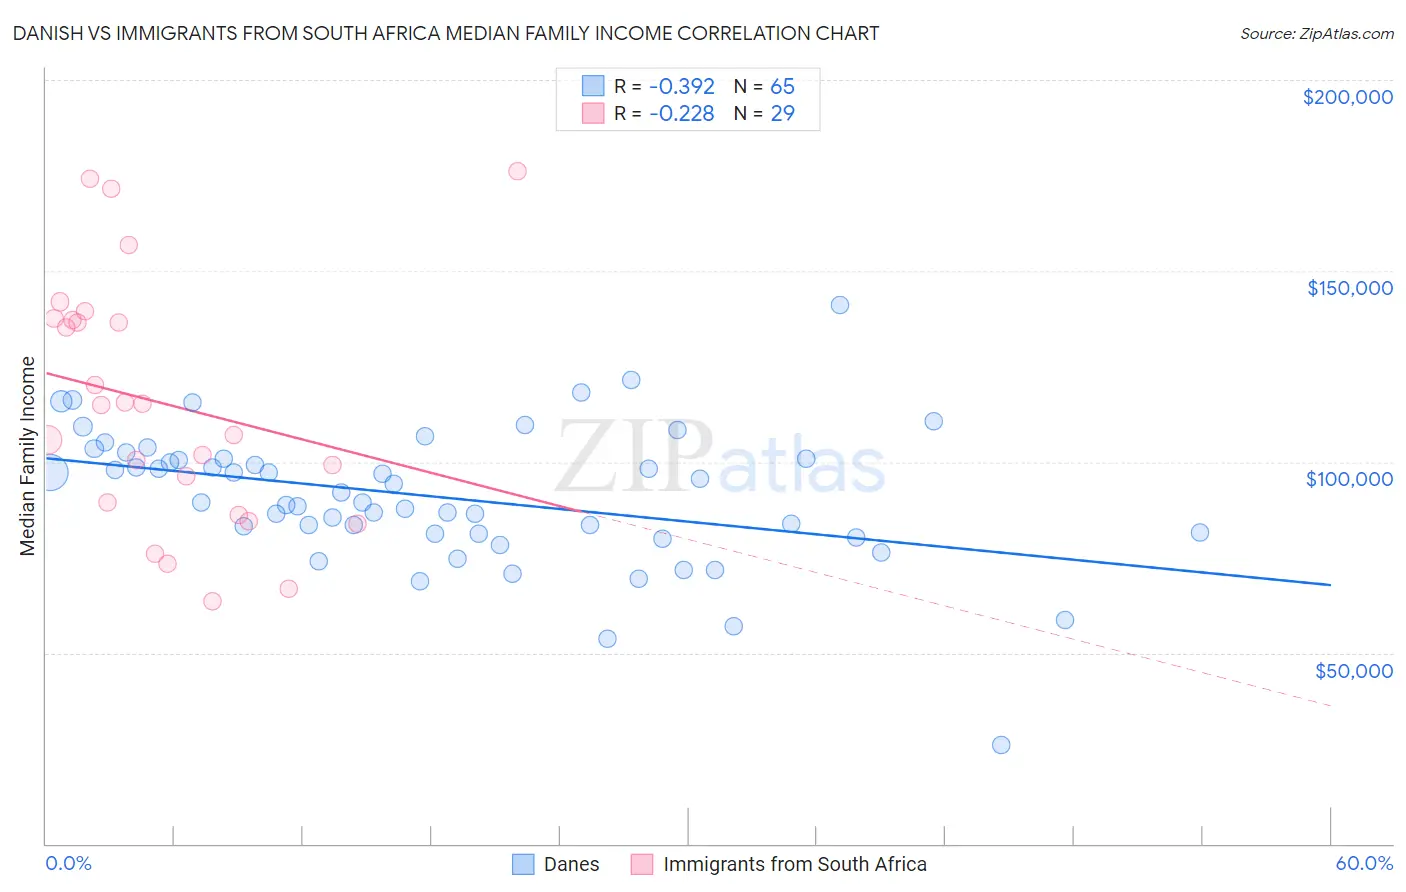
Danish vs Immigrants from South Africa Median Family Income Correlation Chart
The statistical analysis conducted on geographies consisting of 473,651,009 people shows a mild negative correlation between the proportion of Danes and median family income in the United States with a correlation coefficient (R) of -0.392 and weighted average of $105,900. Similarly, the statistical analysis conducted on geographies consisting of 233,253,527 people shows a weak negative correlation between the proportion of Immigrants from South Africa and median family income in the United States with a correlation coefficient (R) of -0.228 and weighted average of $116,286, a difference of 9.8%.
Median Family Income Correlation Summary
| Measurement | Danish | Immigrants from South Africa |
| Minimum | $25,809 | $63,496 |
| Maximum | $140,986 | $176,195 |
| Range | $115,177 | $112,699 |
| Mean | $90,730 | $115,244 |
| Median | $89,508 | $114,820 |
| Interquartile 25% (IQ1) | $81,126 | $87,615 |
| Interquartile 75% (IQ3) | $100,729 | $137,250 |
| Interquartile Range (IQR) | $19,603 | $49,635 |
| Standard Deviation (Sample) | $18,118 | $31,957 |
| Standard Deviation (Population) | $17,979 | $31,402 |
Similar Demographics by Median Family Income
Demographics Similar to Danes by Median Family Income
In terms of median family income, the demographic groups most similar to Danes are Tongan ($105,967, a difference of 0.060%), Immigrants from Morocco ($105,964, a difference of 0.060%), Czech ($105,839, a difference of 0.060%), Slovene ($106,020, a difference of 0.11%), and Immigrants from Syria ($106,118, a difference of 0.21%).
| Demographics | Rating | Rank | Median Family Income |
| Immigrants | Vietnam | 85.7 /100 | #138 | Excellent $106,186 |
| Luxembourgers | 85.7 /100 | #139 | Excellent $106,183 |
| Norwegians | 85.5 /100 | #140 | Excellent $106,144 |
| Immigrants | Syria | 85.3 /100 | #141 | Excellent $106,118 |
| Slovenes | 84.7 /100 | #142 | Excellent $106,020 |
| Tongans | 84.3 /100 | #143 | Excellent $105,967 |
| Immigrants | Morocco | 84.3 /100 | #144 | Excellent $105,964 |
| Danes | 83.8 /100 | #145 | Excellent $105,900 |
| Czechs | 83.4 /100 | #146 | Excellent $105,839 |
| Immigrants | Chile | 82.1 /100 | #147 | Excellent $105,655 |
| Hungarians | 81.7 /100 | #148 | Excellent $105,609 |
| Immigrants | Germany | 80.9 /100 | #149 | Excellent $105,507 |
| Irish | 80.5 /100 | #150 | Excellent $105,453 |
| Peruvians | 80.4 /100 | #151 | Excellent $105,444 |
| Immigrants | Albania | 79.1 /100 | #152 | Good $105,285 |
Demographics Similar to Immigrants from South Africa by Median Family Income
In terms of median family income, the demographic groups most similar to Immigrants from South Africa are Chinese ($116,188, a difference of 0.080%), Immigrants from Czechoslovakia ($116,165, a difference of 0.10%), Immigrants from Malaysia ($115,880, a difference of 0.35%), Maltese ($115,862, a difference of 0.37%), and Immigrants from Norway ($115,847, a difference of 0.38%).
| Demographics | Rating | Rank | Median Family Income |
| Estonians | 100.0 /100 | #41 | Exceptional $118,013 |
| Immigrants | Bolivia | 100.0 /100 | #42 | Exceptional $117,912 |
| Bulgarians | 100.0 /100 | #43 | Exceptional $117,818 |
| Cambodians | 100.0 /100 | #44 | Exceptional $117,780 |
| Immigrants | Greece | 99.9 /100 | #45 | Exceptional $117,344 |
| Immigrants | Russia | 99.9 /100 | #46 | Exceptional $116,942 |
| Immigrants | Austria | 99.9 /100 | #47 | Exceptional $116,830 |
| Immigrants | South Africa | 99.9 /100 | #48 | Exceptional $116,286 |
| Chinese | 99.9 /100 | #49 | Exceptional $116,188 |
| Immigrants | Czechoslovakia | 99.9 /100 | #50 | Exceptional $116,165 |
| Immigrants | Malaysia | 99.9 /100 | #51 | Exceptional $115,880 |
| Maltese | 99.9 /100 | #52 | Exceptional $115,862 |
| Immigrants | Norway | 99.9 /100 | #53 | Exceptional $115,847 |
| Immigrants | Europe | 99.9 /100 | #54 | Exceptional $115,523 |
| Lithuanians | 99.8 /100 | #55 | Exceptional $115,395 |