Indonesian vs Immigrants from South Africa Median Family Income
COMPARE
Indonesian
Immigrants from South Africa
Median Family Income
Median Family Income Comparison
Indonesians
Immigrants from South Africa
$88,301
MEDIAN FAMILY INCOME
0.1/ 100
METRIC RATING
284th/ 347
METRIC RANK
$116,286
MEDIAN FAMILY INCOME
99.9/ 100
METRIC RATING
48th/ 347
METRIC RANK
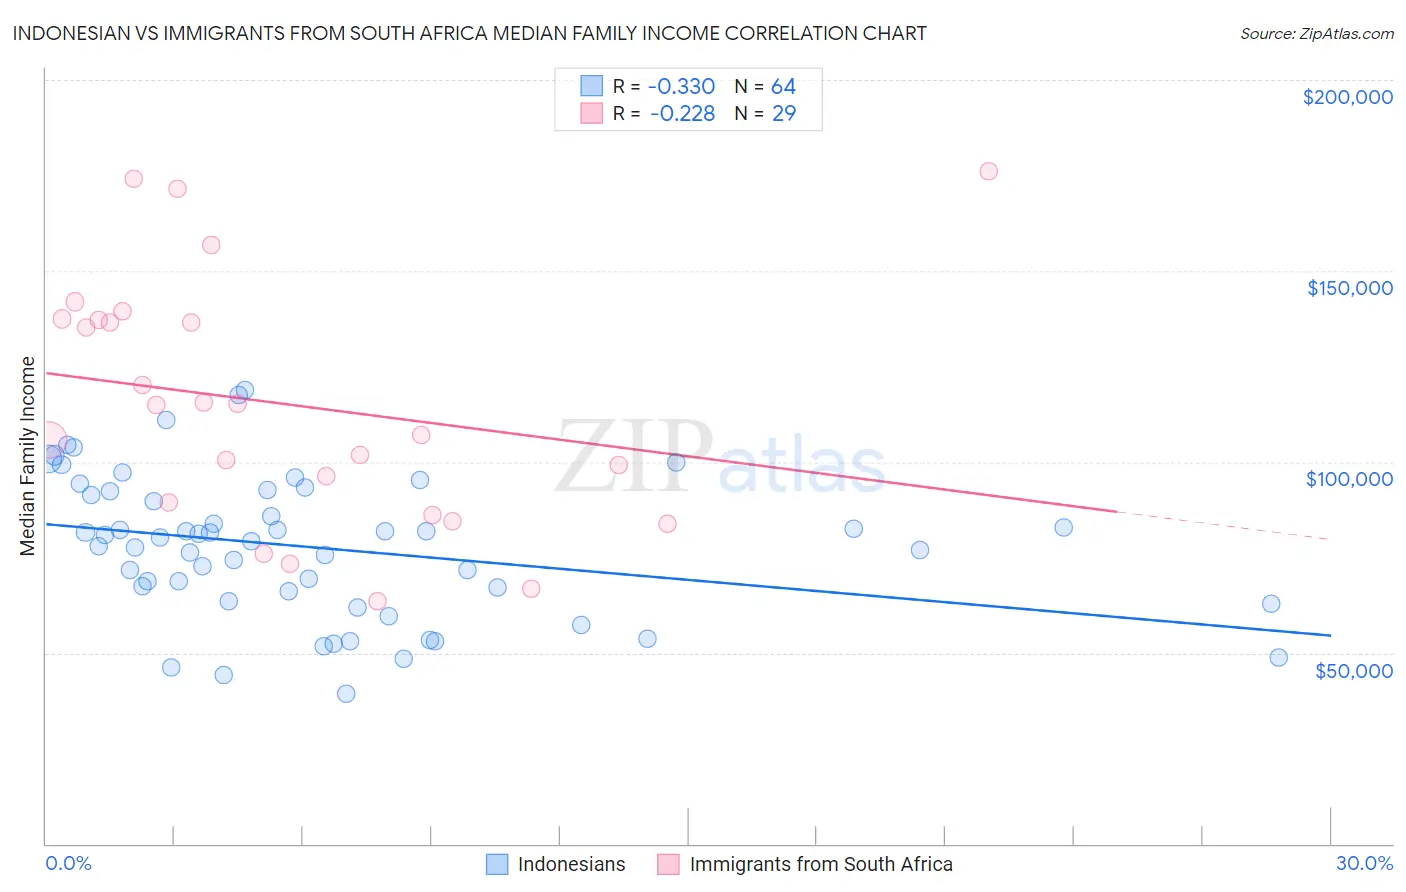
Indonesian vs Immigrants from South Africa Median Family Income Correlation Chart
The statistical analysis conducted on geographies consisting of 162,594,892 people shows a mild negative correlation between the proportion of Indonesians and median family income in the United States with a correlation coefficient (R) of -0.330 and weighted average of $88,301. Similarly, the statistical analysis conducted on geographies consisting of 233,253,527 people shows a weak negative correlation between the proportion of Immigrants from South Africa and median family income in the United States with a correlation coefficient (R) of -0.228 and weighted average of $116,286, a difference of 31.7%.
Median Family Income Correlation Summary
| Measurement | Indonesian | Immigrants from South Africa |
| Minimum | $39,136 | $63,496 |
| Maximum | $118,875 | $176,195 |
| Range | $79,739 | $112,699 |
| Mean | $77,501 | $115,244 |
| Median | $79,746 | $114,820 |
| Interquartile 25% (IQ1) | $64,843 | $87,615 |
| Interquartile 75% (IQ3) | $91,846 | $137,250 |
| Interquartile Range (IQR) | $27,003 | $49,635 |
| Standard Deviation (Sample) | $18,499 | $31,957 |
| Standard Deviation (Population) | $18,353 | $31,402 |
Similar Demographics by Median Family Income
Demographics Similar to Indonesians by Median Family Income
In terms of median family income, the demographic groups most similar to Indonesians are Guatemalan ($88,295, a difference of 0.010%), Immigrants from Nicaragua ($88,267, a difference of 0.040%), Potawatomi ($88,265, a difference of 0.040%), Bangladeshi ($88,358, a difference of 0.060%), and Cherokee ($88,209, a difference of 0.10%).
| Demographics | Rating | Rank | Median Family Income |
| Immigrants | Jamaica | 0.1 /100 | #277 | Tragic $89,268 |
| Immigrants | Grenada | 0.1 /100 | #278 | Tragic $89,249 |
| Immigrants | Belize | 0.1 /100 | #279 | Tragic $89,197 |
| British West Indians | 0.1 /100 | #280 | Tragic $88,987 |
| Blackfeet | 0.1 /100 | #281 | Tragic $88,717 |
| Comanche | 0.1 /100 | #282 | Tragic $88,556 |
| Bangladeshis | 0.1 /100 | #283 | Tragic $88,358 |
| Indonesians | 0.1 /100 | #284 | Tragic $88,301 |
| Guatemalans | 0.1 /100 | #285 | Tragic $88,295 |
| Immigrants | Nicaragua | 0.1 /100 | #286 | Tragic $88,267 |
| Potawatomi | 0.1 /100 | #287 | Tragic $88,265 |
| Cherokee | 0.1 /100 | #288 | Tragic $88,209 |
| Central American Indians | 0.1 /100 | #289 | Tragic $88,034 |
| Shoshone | 0.1 /100 | #290 | Tragic $87,872 |
| Immigrants | Cabo Verde | 0.1 /100 | #291 | Tragic $87,830 |
Demographics Similar to Immigrants from South Africa by Median Family Income
In terms of median family income, the demographic groups most similar to Immigrants from South Africa are Chinese ($116,188, a difference of 0.080%), Immigrants from Czechoslovakia ($116,165, a difference of 0.10%), Immigrants from Malaysia ($115,880, a difference of 0.35%), Maltese ($115,862, a difference of 0.37%), and Immigrants from Norway ($115,847, a difference of 0.38%).
| Demographics | Rating | Rank | Median Family Income |
| Estonians | 100.0 /100 | #41 | Exceptional $118,013 |
| Immigrants | Bolivia | 100.0 /100 | #42 | Exceptional $117,912 |
| Bulgarians | 100.0 /100 | #43 | Exceptional $117,818 |
| Cambodians | 100.0 /100 | #44 | Exceptional $117,780 |
| Immigrants | Greece | 99.9 /100 | #45 | Exceptional $117,344 |
| Immigrants | Russia | 99.9 /100 | #46 | Exceptional $116,942 |
| Immigrants | Austria | 99.9 /100 | #47 | Exceptional $116,830 |
| Immigrants | South Africa | 99.9 /100 | #48 | Exceptional $116,286 |
| Chinese | 99.9 /100 | #49 | Exceptional $116,188 |
| Immigrants | Czechoslovakia | 99.9 /100 | #50 | Exceptional $116,165 |
| Immigrants | Malaysia | 99.9 /100 | #51 | Exceptional $115,880 |
| Maltese | 99.9 /100 | #52 | Exceptional $115,862 |
| Immigrants | Norway | 99.9 /100 | #53 | Exceptional $115,847 |
| Immigrants | Europe | 99.9 /100 | #54 | Exceptional $115,523 |
| Lithuanians | 99.8 /100 | #55 | Exceptional $115,395 |