Scotch-Irish vs Hispanic or Latino Per Capita Income
COMPARE
Scotch-Irish
Hispanic or Latino
Per Capita Income
Per Capita Income Comparison
Scotch-Irish
Hispanics or Latinos
$42,563
PER CAPITA INCOME
22.6/ 100
METRIC RATING
197th/ 347
METRIC RANK
$35,688
PER CAPITA INCOME
0.0/ 100
METRIC RATING
320th/ 347
METRIC RANK
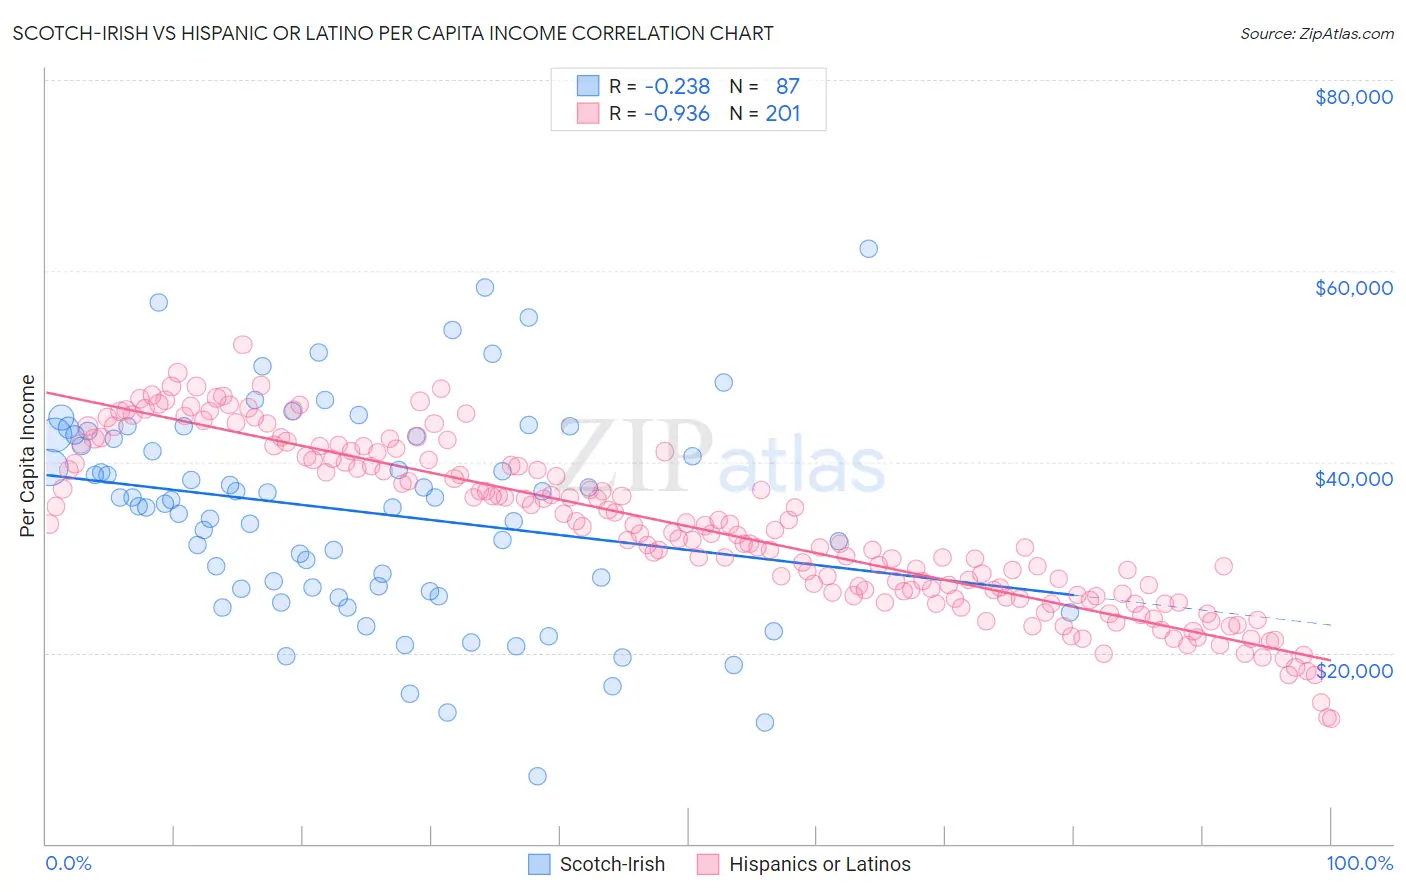
Scotch-Irish vs Hispanic or Latino Per Capita Income Correlation Chart
The statistical analysis conducted on geographies consisting of 548,816,006 people shows a weak negative correlation between the proportion of Scotch-Irish and per capita income in the United States with a correlation coefficient (R) of -0.238 and weighted average of $42,563. Similarly, the statistical analysis conducted on geographies consisting of 578,671,475 people shows a near-perfect negative correlation between the proportion of Hispanics or Latinos and per capita income in the United States with a correlation coefficient (R) of -0.936 and weighted average of $35,688, a difference of 19.3%.
Per Capita Income Correlation Summary
| Measurement | Scotch-Irish | Hispanic or Latino |
| Minimum | $7,124 | $13,071 |
| Maximum | $62,377 | $52,297 |
| Range | $55,253 | $39,226 |
| Mean | $34,830 | $33,168 |
| Median | $35,981 | $32,664 |
| Interquartile 25% (IQ1) | $26,689 | $26,111 |
| Interquartile 75% (IQ3) | $42,802 | $40,424 |
| Interquartile Range (IQR) | $16,113 | $14,314 |
| Standard Deviation (Sample) | $10,987 | $8,715 |
| Standard Deviation (Population) | $10,923 | $8,693 |
Similar Demographics by Per Capita Income
Demographics Similar to Scotch-Irish by Per Capita Income
In terms of per capita income, the demographic groups most similar to Scotch-Irish are Dutch ($42,605, a difference of 0.10%), Immigrants from Kenya ($42,661, a difference of 0.23%), Immigrants from Fiji ($42,694, a difference of 0.31%), Immigrants from Portugal ($42,412, a difference of 0.36%), and Barbadian ($42,406, a difference of 0.37%).
| Demographics | Rating | Rank | Per Capita Income |
| Kenyans | 27.7 /100 | #190 | Fair $42,808 |
| Yugoslavians | 27.4 /100 | #191 | Fair $42,792 |
| Iraqis | 26.7 /100 | #192 | Fair $42,760 |
| Immigrants | Sierra Leone | 26.5 /100 | #193 | Fair $42,752 |
| Immigrants | Fiji | 25.2 /100 | #194 | Fair $42,694 |
| Immigrants | Kenya | 24.5 /100 | #195 | Fair $42,661 |
| Dutch | 23.4 /100 | #196 | Fair $42,605 |
| Scotch-Irish | 22.6 /100 | #197 | Fair $42,563 |
| Immigrants | Portugal | 19.7 /100 | #198 | Poor $42,412 |
| Barbadians | 19.6 /100 | #199 | Poor $42,406 |
| Vietnamese | 19.0 /100 | #200 | Poor $42,368 |
| Immigrants | Thailand | 17.6 /100 | #201 | Poor $42,289 |
| Immigrants | Bosnia and Herzegovina | 17.5 /100 | #202 | Poor $42,278 |
| Spanish | 17.0 /100 | #203 | Poor $42,249 |
| Aleuts | 16.4 /100 | #204 | Poor $42,210 |
Demographics Similar to Hispanics or Latinos by Per Capita Income
In terms of per capita income, the demographic groups most similar to Hispanics or Latinos are Immigrants from Congo ($35,720, a difference of 0.090%), Black/African American ($35,564, a difference of 0.35%), Creek ($35,546, a difference of 0.40%), Bangladeshi ($35,897, a difference of 0.59%), and Dutch West Indian ($35,922, a difference of 0.66%).
| Demographics | Rating | Rank | Per Capita Income |
| Bahamians | 0.0 /100 | #313 | Tragic $36,427 |
| Seminole | 0.0 /100 | #314 | Tragic $36,180 |
| Yaqui | 0.0 /100 | #315 | Tragic $36,112 |
| Choctaw | 0.0 /100 | #316 | Tragic $35,999 |
| Dutch West Indians | 0.0 /100 | #317 | Tragic $35,922 |
| Bangladeshis | 0.0 /100 | #318 | Tragic $35,897 |
| Immigrants | Congo | 0.0 /100 | #319 | Tragic $35,720 |
| Hispanics or Latinos | 0.0 /100 | #320 | Tragic $35,688 |
| Blacks/African Americans | 0.0 /100 | #321 | Tragic $35,564 |
| Creek | 0.0 /100 | #322 | Tragic $35,546 |
| Cheyenne | 0.0 /100 | #323 | Tragic $35,276 |
| Kiowa | 0.0 /100 | #324 | Tragic $35,102 |
| Immigrants | Central America | 0.0 /100 | #325 | Tragic $34,974 |
| Immigrants | Cuba | 0.0 /100 | #326 | Tragic $34,910 |
| Apache | 0.0 /100 | #327 | Tragic $34,886 |