Scotch-Irish vs British West Indian Per Capita Income
COMPARE
Scotch-Irish
British West Indian
Per Capita Income
Per Capita Income Comparison
Scotch-Irish
British West Indians
$42,563
PER CAPITA INCOME
22.6/ 100
METRIC RATING
197th/ 347
METRIC RANK
$40,330
PER CAPITA INCOME
2.3/ 100
METRIC RATING
241st/ 347
METRIC RANK
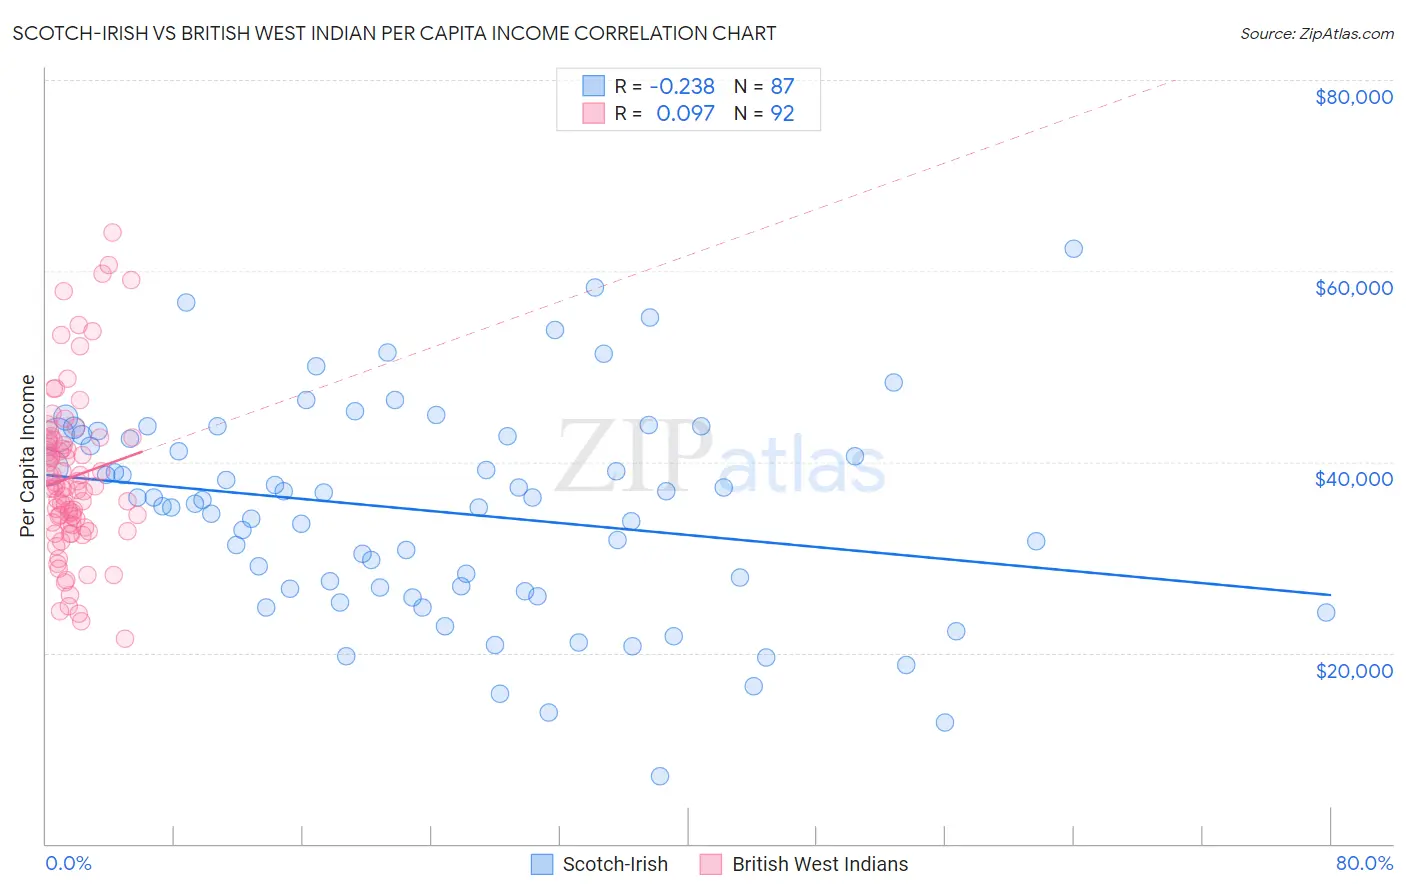
Scotch-Irish vs British West Indian Per Capita Income Correlation Chart
The statistical analysis conducted on geographies consisting of 548,816,006 people shows a weak negative correlation between the proportion of Scotch-Irish and per capita income in the United States with a correlation coefficient (R) of -0.238 and weighted average of $42,563. Similarly, the statistical analysis conducted on geographies consisting of 152,702,927 people shows a slight positive correlation between the proportion of British West Indians and per capita income in the United States with a correlation coefficient (R) of 0.097 and weighted average of $40,330, a difference of 5.5%.
Per Capita Income Correlation Summary
| Measurement | Scotch-Irish | British West Indian |
| Minimum | $7,124 | $21,502 |
| Maximum | $62,377 | $63,988 |
| Range | $55,253 | $42,486 |
| Mean | $34,830 | $38,416 |
| Median | $35,981 | $37,296 |
| Interquartile 25% (IQ1) | $26,689 | $33,460 |
| Interquartile 75% (IQ3) | $42,802 | $42,145 |
| Interquartile Range (IQR) | $16,113 | $8,686 |
| Standard Deviation (Sample) | $10,987 | $8,471 |
| Standard Deviation (Population) | $10,923 | $8,425 |
Similar Demographics by Per Capita Income
Demographics Similar to Scotch-Irish by Per Capita Income
In terms of per capita income, the demographic groups most similar to Scotch-Irish are Dutch ($42,605, a difference of 0.10%), Immigrants from Kenya ($42,661, a difference of 0.23%), Immigrants from Fiji ($42,694, a difference of 0.31%), Immigrants from Portugal ($42,412, a difference of 0.36%), and Barbadian ($42,406, a difference of 0.37%).
| Demographics | Rating | Rank | Per Capita Income |
| Kenyans | 27.7 /100 | #190 | Fair $42,808 |
| Yugoslavians | 27.4 /100 | #191 | Fair $42,792 |
| Iraqis | 26.7 /100 | #192 | Fair $42,760 |
| Immigrants | Sierra Leone | 26.5 /100 | #193 | Fair $42,752 |
| Immigrants | Fiji | 25.2 /100 | #194 | Fair $42,694 |
| Immigrants | Kenya | 24.5 /100 | #195 | Fair $42,661 |
| Dutch | 23.4 /100 | #196 | Fair $42,605 |
| Scotch-Irish | 22.6 /100 | #197 | Fair $42,563 |
| Immigrants | Portugal | 19.7 /100 | #198 | Poor $42,412 |
| Barbadians | 19.6 /100 | #199 | Poor $42,406 |
| Vietnamese | 19.0 /100 | #200 | Poor $42,368 |
| Immigrants | Thailand | 17.6 /100 | #201 | Poor $42,289 |
| Immigrants | Bosnia and Herzegovina | 17.5 /100 | #202 | Poor $42,278 |
| Spanish | 17.0 /100 | #203 | Poor $42,249 |
| Aleuts | 16.4 /100 | #204 | Poor $42,210 |
Demographics Similar to British West Indians by Per Capita Income
In terms of per capita income, the demographic groups most similar to British West Indians are Immigrants from Nigeria ($40,339, a difference of 0.020%), Tsimshian ($40,344, a difference of 0.040%), Somali ($40,367, a difference of 0.090%), Immigrants from Western Africa ($40,294, a difference of 0.090%), and German Russian ($40,266, a difference of 0.16%).
| Demographics | Rating | Rank | Per Capita Income |
| Immigrants | West Indies | 3.7 /100 | #234 | Tragic $40,763 |
| Immigrants | Guyana | 3.6 /100 | #235 | Tragic $40,742 |
| Immigrants | Nonimmigrants | 3.4 /100 | #236 | Tragic $40,669 |
| Immigrants | Cambodia | 2.6 /100 | #237 | Tragic $40,434 |
| Somalis | 2.4 /100 | #238 | Tragic $40,367 |
| Tsimshian | 2.4 /100 | #239 | Tragic $40,344 |
| Immigrants | Nigeria | 2.3 /100 | #240 | Tragic $40,339 |
| British West Indians | 2.3 /100 | #241 | Tragic $40,330 |
| Immigrants | Western Africa | 2.2 /100 | #242 | Tragic $40,294 |
| German Russians | 2.2 /100 | #243 | Tragic $40,266 |
| French American Indians | 2.1 /100 | #244 | Tragic $40,244 |
| Sub-Saharan Africans | 1.9 /100 | #245 | Tragic $40,152 |
| Cree | 1.7 /100 | #246 | Tragic $40,056 |
| Immigrants | Somalia | 1.6 /100 | #247 | Tragic $39,974 |
| Cape Verdeans | 1.5 /100 | #248 | Tragic $39,935 |