Scotch-Irish vs Immigrants from Switzerland Per Capita Income
COMPARE
Scotch-Irish
Immigrants from Switzerland
Per Capita Income
Per Capita Income Comparison
Scotch-Irish
Immigrants from Switzerland
$42,563
PER CAPITA INCOME
22.6/ 100
METRIC RATING
197th/ 347
METRIC RANK
$54,866
PER CAPITA INCOME
100.0/ 100
METRIC RATING
16th/ 347
METRIC RANK
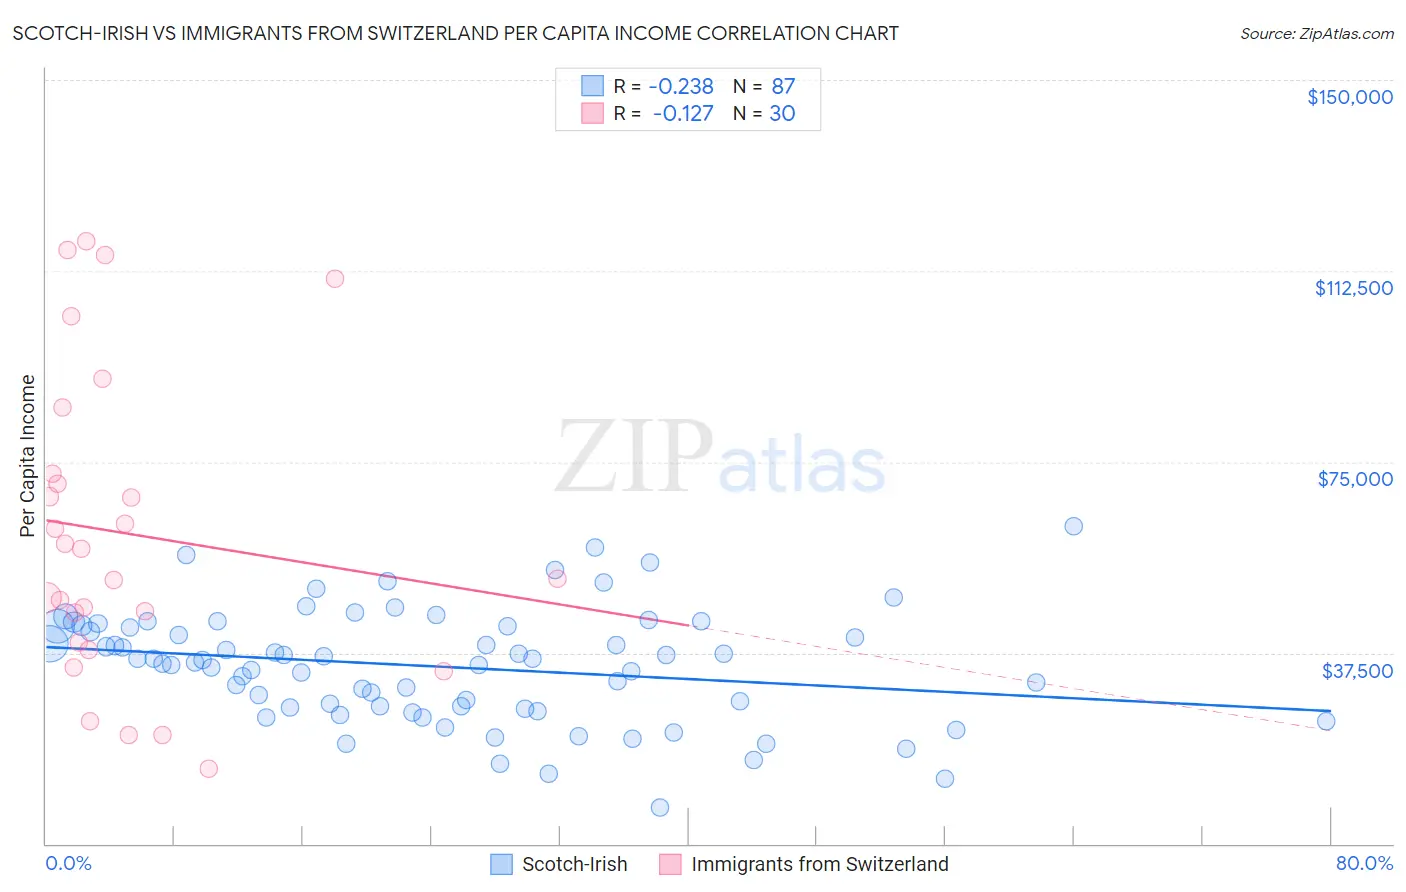
Scotch-Irish vs Immigrants from Switzerland Per Capita Income Correlation Chart
The statistical analysis conducted on geographies consisting of 548,816,006 people shows a weak negative correlation between the proportion of Scotch-Irish and per capita income in the United States with a correlation coefficient (R) of -0.238 and weighted average of $42,563. Similarly, the statistical analysis conducted on geographies consisting of 148,083,583 people shows a poor negative correlation between the proportion of Immigrants from Switzerland and per capita income in the United States with a correlation coefficient (R) of -0.127 and weighted average of $54,866, a difference of 28.9%.
Per Capita Income Correlation Summary
| Measurement | Scotch-Irish | Immigrants from Switzerland |
| Minimum | $7,124 | $14,801 |
| Maximum | $62,377 | $118,438 |
| Range | $55,253 | $103,637 |
| Mean | $34,830 | $60,936 |
| Median | $35,981 | $54,944 |
| Interquartile 25% (IQ1) | $26,689 | $39,569 |
| Interquartile 75% (IQ3) | $42,802 | $72,692 |
| Interquartile Range (IQR) | $16,113 | $33,123 |
| Standard Deviation (Sample) | $10,987 | $29,867 |
| Standard Deviation (Population) | $10,923 | $29,365 |
Similar Demographics by Per Capita Income
Demographics Similar to Scotch-Irish by Per Capita Income
In terms of per capita income, the demographic groups most similar to Scotch-Irish are Dutch ($42,605, a difference of 0.10%), Immigrants from Kenya ($42,661, a difference of 0.23%), Immigrants from Fiji ($42,694, a difference of 0.31%), Immigrants from Portugal ($42,412, a difference of 0.36%), and Barbadian ($42,406, a difference of 0.37%).
| Demographics | Rating | Rank | Per Capita Income |
| Kenyans | 27.7 /100 | #190 | Fair $42,808 |
| Yugoslavians | 27.4 /100 | #191 | Fair $42,792 |
| Iraqis | 26.7 /100 | #192 | Fair $42,760 |
| Immigrants | Sierra Leone | 26.5 /100 | #193 | Fair $42,752 |
| Immigrants | Fiji | 25.2 /100 | #194 | Fair $42,694 |
| Immigrants | Kenya | 24.5 /100 | #195 | Fair $42,661 |
| Dutch | 23.4 /100 | #196 | Fair $42,605 |
| Scotch-Irish | 22.6 /100 | #197 | Fair $42,563 |
| Immigrants | Portugal | 19.7 /100 | #198 | Poor $42,412 |
| Barbadians | 19.6 /100 | #199 | Poor $42,406 |
| Vietnamese | 19.0 /100 | #200 | Poor $42,368 |
| Immigrants | Thailand | 17.6 /100 | #201 | Poor $42,289 |
| Immigrants | Bosnia and Herzegovina | 17.5 /100 | #202 | Poor $42,278 |
| Spanish | 17.0 /100 | #203 | Poor $42,249 |
| Aleuts | 16.4 /100 | #204 | Poor $42,210 |
Demographics Similar to Immigrants from Switzerland by Per Capita Income
In terms of per capita income, the demographic groups most similar to Immigrants from Switzerland are Cypriot ($54,899, a difference of 0.060%), Immigrants from Belgium ($55,082, a difference of 0.39%), Immigrants from France ($54,557, a difference of 0.57%), Immigrants from India ($55,268, a difference of 0.73%), and Thai ($54,307, a difference of 1.0%).
| Demographics | Rating | Rank | Per Capita Income |
| Immigrants | Ireland | 100.0 /100 | #9 | Exceptional $56,584 |
| Okinawans | 100.0 /100 | #10 | Exceptional $55,817 |
| Eastern Europeans | 100.0 /100 | #11 | Exceptional $55,780 |
| Immigrants | Sweden | 100.0 /100 | #12 | Exceptional $55,582 |
| Immigrants | India | 100.0 /100 | #13 | Exceptional $55,268 |
| Immigrants | Belgium | 100.0 /100 | #14 | Exceptional $55,082 |
| Cypriots | 100.0 /100 | #15 | Exceptional $54,899 |
| Immigrants | Switzerland | 100.0 /100 | #16 | Exceptional $54,866 |
| Immigrants | France | 100.0 /100 | #17 | Exceptional $54,557 |
| Thais | 100.0 /100 | #18 | Exceptional $54,307 |
| Immigrants | China | 100.0 /100 | #19 | Exceptional $54,264 |
| Soviet Union | 100.0 /100 | #20 | Exceptional $54,202 |
| Immigrants | Northern Europe | 100.0 /100 | #21 | Exceptional $54,159 |
| Indians (Asian) | 100.0 /100 | #22 | Exceptional $53,874 |
| Immigrants | Eastern Asia | 100.0 /100 | #23 | Exceptional $53,806 |