Slovak vs Shoshone Median Male Earnings
COMPARE
Slovak
Shoshone
Median Male Earnings
Median Male Earnings Comparison
Slovaks
Shoshone
$56,306
MEDIAN MALE EARNINGS
85.5/ 100
METRIC RATING
138th/ 347
METRIC RANK
$47,930
MEDIAN MALE EARNINGS
0.2/ 100
METRIC RATING
288th/ 347
METRIC RANK
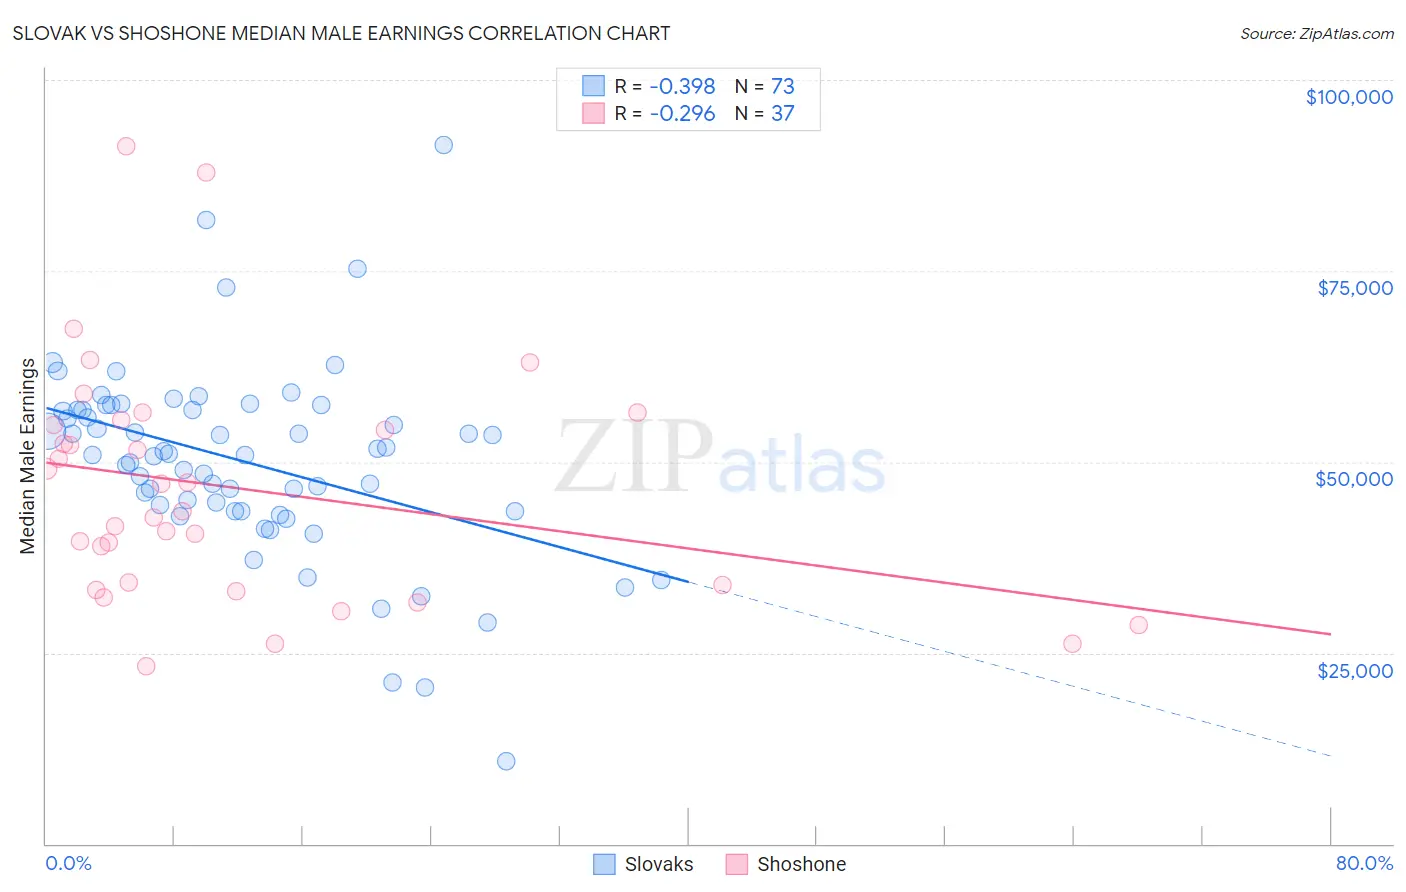
Slovak vs Shoshone Median Male Earnings Correlation Chart
The statistical analysis conducted on geographies consisting of 397,698,254 people shows a mild negative correlation between the proportion of Slovaks and median male earnings in the United States with a correlation coefficient (R) of -0.398 and weighted average of $56,306. Similarly, the statistical analysis conducted on geographies consisting of 66,614,721 people shows a weak negative correlation between the proportion of Shoshone and median male earnings in the United States with a correlation coefficient (R) of -0.296 and weighted average of $47,930, a difference of 17.5%.
Median Male Earnings Correlation Summary
| Measurement | Slovak | Shoshone |
| Minimum | $10,727 | $23,214 |
| Maximum | $91,563 | $91,250 |
| Range | $80,836 | $68,036 |
| Mean | $49,965 | $46,471 |
| Median | $50,933 | $43,516 |
| Interquartile 25% (IQ1) | $43,560 | $33,573 |
| Interquartile 75% (IQ3) | $56,815 | $55,141 |
| Interquartile Range (IQR) | $13,254 | $21,568 |
| Standard Deviation (Sample) | $12,608 | $15,536 |
| Standard Deviation (Population) | $12,522 | $15,324 |
Similar Demographics by Median Male Earnings
Demographics Similar to Slovaks by Median Male Earnings
In terms of median male earnings, the demographic groups most similar to Slovaks are Zimbabwean ($56,302, a difference of 0.010%), Luxembourger ($56,300, a difference of 0.010%), Danish ($56,246, a difference of 0.11%), Ethiopian ($56,243, a difference of 0.11%), and Slavic ($56,390, a difference of 0.15%).
| Demographics | Rating | Rank | Median Male Earnings |
| Portuguese | 89.4 /100 | #131 | Excellent $56,663 |
| Czechs | 88.2 /100 | #132 | Excellent $56,546 |
| Immigrants | Germany | 88.2 /100 | #133 | Excellent $56,542 |
| Moroccans | 87.7 /100 | #134 | Excellent $56,499 |
| Irish | 87.4 /100 | #135 | Excellent $56,464 |
| Immigrants | Saudi Arabia | 87.2 /100 | #136 | Excellent $56,452 |
| Slavs | 86.5 /100 | #137 | Excellent $56,390 |
| Slovaks | 85.5 /100 | #138 | Excellent $56,306 |
| Zimbabweans | 85.5 /100 | #139 | Excellent $56,302 |
| Luxembourgers | 85.5 /100 | #140 | Excellent $56,300 |
| Danes | 84.8 /100 | #141 | Excellent $56,246 |
| Ethiopians | 84.8 /100 | #142 | Excellent $56,243 |
| Sri Lankans | 83.4 /100 | #143 | Excellent $56,136 |
| Immigrants | Uganda | 82.4 /100 | #144 | Excellent $56,064 |
| Norwegians | 80.9 /100 | #145 | Excellent $55,965 |
Demographics Similar to Shoshone by Median Male Earnings
In terms of median male earnings, the demographic groups most similar to Shoshone are Immigrants from El Salvador ($47,973, a difference of 0.090%), Mexican American Indian ($47,990, a difference of 0.12%), African ($47,994, a difference of 0.13%), Paiute ($47,991, a difference of 0.13%), and Chickasaw ($47,832, a difference of 0.21%).
| Demographics | Rating | Rank | Median Male Earnings |
| Marshallese | 0.2 /100 | #281 | Tragic $48,137 |
| Central Americans | 0.2 /100 | #282 | Tragic $48,093 |
| Immigrants | Jamaica | 0.2 /100 | #283 | Tragic $48,040 |
| Africans | 0.2 /100 | #284 | Tragic $47,994 |
| Paiute | 0.2 /100 | #285 | Tragic $47,991 |
| Mexican American Indians | 0.2 /100 | #286 | Tragic $47,990 |
| Immigrants | El Salvador | 0.2 /100 | #287 | Tragic $47,973 |
| Shoshone | 0.2 /100 | #288 | Tragic $47,930 |
| Chickasaw | 0.1 /100 | #289 | Tragic $47,832 |
| Immigrants | Belize | 0.1 /100 | #290 | Tragic $47,809 |
| Choctaw | 0.1 /100 | #291 | Tragic $47,729 |
| Immigrants | Dominica | 0.1 /100 | #292 | Tragic $47,651 |
| Indonesians | 0.1 /100 | #293 | Tragic $47,503 |
| Immigrants | Nicaragua | 0.1 /100 | #294 | Tragic $47,482 |
| Central American Indians | 0.1 /100 | #295 | Tragic $47,433 |