Lithuanian vs Shoshone Median Male Earnings
COMPARE
Lithuanian
Shoshone
Median Male Earnings
Median Male Earnings Comparison
Lithuanians
Shoshone
$61,228
MEDIAN MALE EARNINGS
99.9/ 100
METRIC RATING
56th/ 347
METRIC RANK
$47,930
MEDIAN MALE EARNINGS
0.2/ 100
METRIC RATING
288th/ 347
METRIC RANK
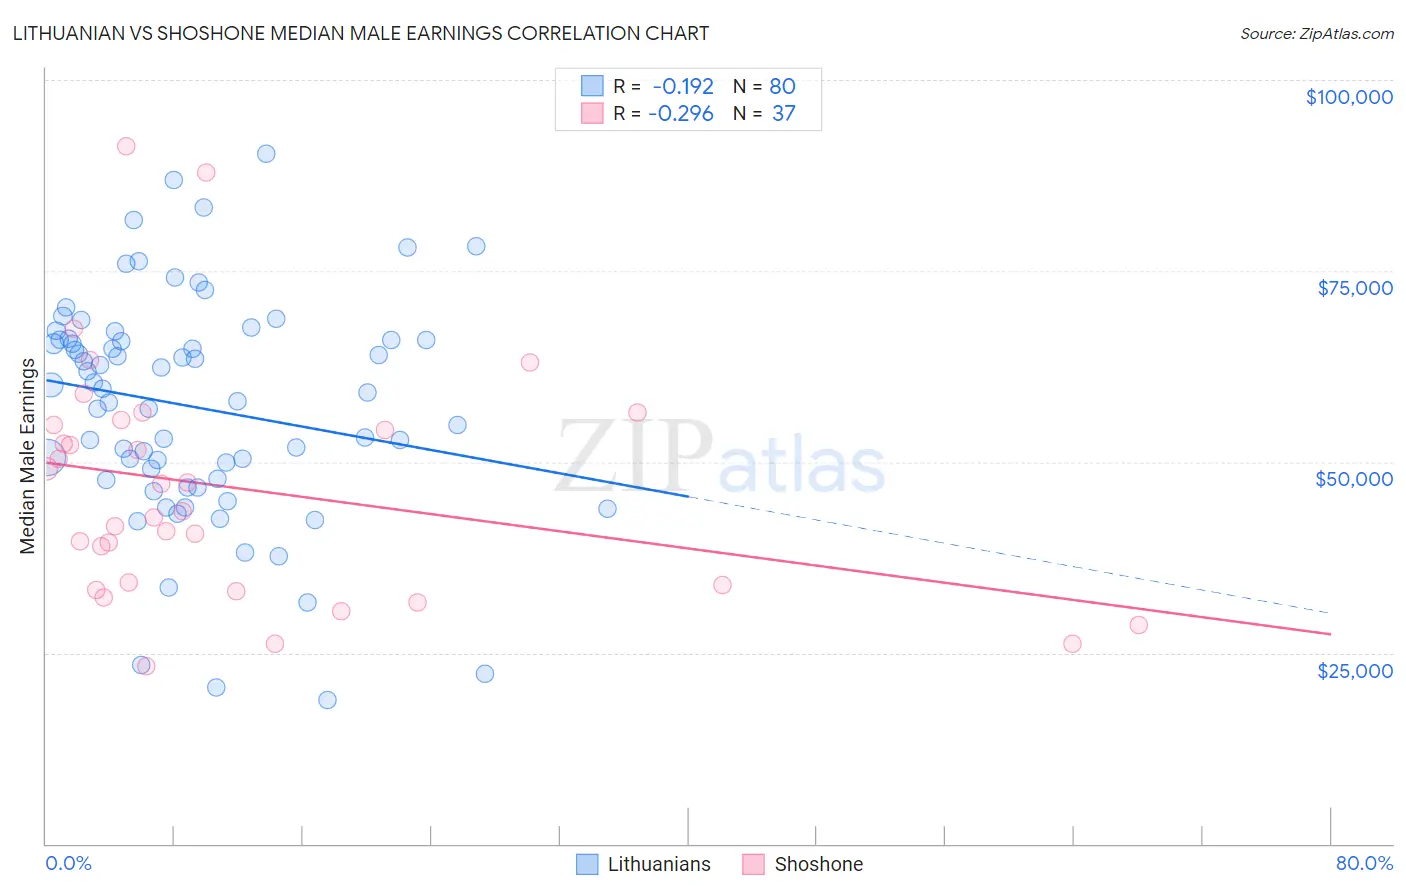
Lithuanian vs Shoshone Median Male Earnings Correlation Chart
The statistical analysis conducted on geographies consisting of 421,749,133 people shows a poor negative correlation between the proportion of Lithuanians and median male earnings in the United States with a correlation coefficient (R) of -0.192 and weighted average of $61,228. Similarly, the statistical analysis conducted on geographies consisting of 66,614,721 people shows a weak negative correlation between the proportion of Shoshone and median male earnings in the United States with a correlation coefficient (R) of -0.296 and weighted average of $47,930, a difference of 27.7%.
Median Male Earnings Correlation Summary
| Measurement | Lithuanian | Shoshone |
| Minimum | $18,839 | $23,214 |
| Maximum | $90,313 | $91,250 |
| Range | $71,474 | $68,036 |
| Mean | $57,160 | $46,471 |
| Median | $59,359 | $43,516 |
| Interquartile 25% (IQ1) | $47,714 | $33,573 |
| Interquartile 75% (IQ3) | $66,000 | $55,141 |
| Interquartile Range (IQR) | $18,286 | $21,568 |
| Standard Deviation (Sample) | $14,769 | $15,536 |
| Standard Deviation (Population) | $14,676 | $15,324 |
Similar Demographics by Median Male Earnings
Demographics Similar to Lithuanians by Median Male Earnings
In terms of median male earnings, the demographic groups most similar to Lithuanians are Immigrants from Scotland ($61,220, a difference of 0.010%), Greek ($61,242, a difference of 0.020%), New Zealander ($61,199, a difference of 0.050%), Immigrants from Netherlands ($61,096, a difference of 0.22%), and Egyptian ($61,095, a difference of 0.22%).
| Demographics | Rating | Rank | Median Male Earnings |
| Immigrants | Europe | 99.9 /100 | #49 | Exceptional $62,057 |
| Bhutanese | 99.9 /100 | #50 | Exceptional $61,759 |
| Estonians | 99.9 /100 | #51 | Exceptional $61,710 |
| Immigrants | Norway | 99.9 /100 | #52 | Exceptional $61,628 |
| South Africans | 99.9 /100 | #53 | Exceptional $61,460 |
| Immigrants | Latvia | 99.9 /100 | #54 | Exceptional $61,422 |
| Greeks | 99.9 /100 | #55 | Exceptional $61,242 |
| Lithuanians | 99.9 /100 | #56 | Exceptional $61,228 |
| Immigrants | Scotland | 99.9 /100 | #57 | Exceptional $61,220 |
| New Zealanders | 99.9 /100 | #58 | Exceptional $61,199 |
| Immigrants | Netherlands | 99.8 /100 | #59 | Exceptional $61,096 |
| Egyptians | 99.8 /100 | #60 | Exceptional $61,095 |
| Bolivians | 99.8 /100 | #61 | Exceptional $61,066 |
| Immigrants | Romania | 99.8 /100 | #62 | Exceptional $61,040 |
| Immigrants | Pakistan | 99.8 /100 | #63 | Exceptional $60,987 |
Demographics Similar to Shoshone by Median Male Earnings
In terms of median male earnings, the demographic groups most similar to Shoshone are Immigrants from El Salvador ($47,973, a difference of 0.090%), Mexican American Indian ($47,990, a difference of 0.12%), African ($47,994, a difference of 0.13%), Paiute ($47,991, a difference of 0.13%), and Chickasaw ($47,832, a difference of 0.21%).
| Demographics | Rating | Rank | Median Male Earnings |
| Marshallese | 0.2 /100 | #281 | Tragic $48,137 |
| Central Americans | 0.2 /100 | #282 | Tragic $48,093 |
| Immigrants | Jamaica | 0.2 /100 | #283 | Tragic $48,040 |
| Africans | 0.2 /100 | #284 | Tragic $47,994 |
| Paiute | 0.2 /100 | #285 | Tragic $47,991 |
| Mexican American Indians | 0.2 /100 | #286 | Tragic $47,990 |
| Immigrants | El Salvador | 0.2 /100 | #287 | Tragic $47,973 |
| Shoshone | 0.2 /100 | #288 | Tragic $47,930 |
| Chickasaw | 0.1 /100 | #289 | Tragic $47,832 |
| Immigrants | Belize | 0.1 /100 | #290 | Tragic $47,809 |
| Choctaw | 0.1 /100 | #291 | Tragic $47,729 |
| Immigrants | Dominica | 0.1 /100 | #292 | Tragic $47,651 |
| Indonesians | 0.1 /100 | #293 | Tragic $47,503 |
| Immigrants | Nicaragua | 0.1 /100 | #294 | Tragic $47,482 |
| Central American Indians | 0.1 /100 | #295 | Tragic $47,433 |