Honduran vs Shoshone Median Male Earnings
COMPARE
Honduran
Shoshone
Median Male Earnings
Median Male Earnings Comparison
Hondurans
Shoshone
$46,374
MEDIAN MALE EARNINGS
0.0/ 100
METRIC RATING
313th/ 347
METRIC RANK
$47,930
MEDIAN MALE EARNINGS
0.2/ 100
METRIC RATING
288th/ 347
METRIC RANK
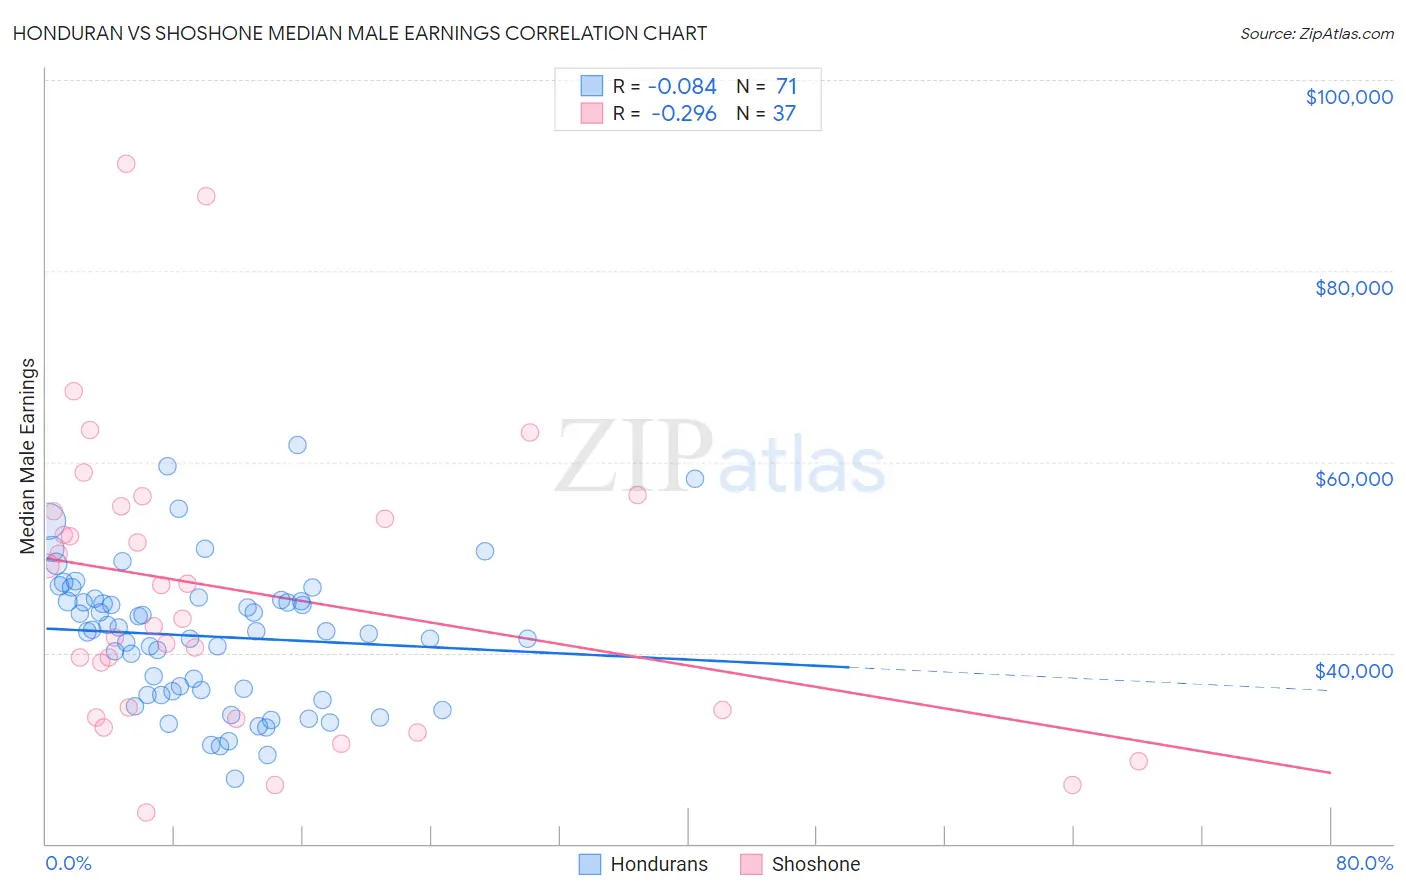
Honduran vs Shoshone Median Male Earnings Correlation Chart
The statistical analysis conducted on geographies consisting of 357,792,552 people shows a slight negative correlation between the proportion of Hondurans and median male earnings in the United States with a correlation coefficient (R) of -0.084 and weighted average of $46,374. Similarly, the statistical analysis conducted on geographies consisting of 66,614,721 people shows a weak negative correlation between the proportion of Shoshone and median male earnings in the United States with a correlation coefficient (R) of -0.296 and weighted average of $47,930, a difference of 3.4%.
Median Male Earnings Correlation Summary
| Measurement | Honduran | Shoshone |
| Minimum | $26,786 | $23,214 |
| Maximum | $61,786 | $91,250 |
| Range | $35,000 | $68,036 |
| Mean | $41,717 | $46,471 |
| Median | $42,264 | $43,516 |
| Interquartile 25% (IQ1) | $35,639 | $33,573 |
| Interquartile 75% (IQ3) | $45,572 | $55,141 |
| Interquartile Range (IQR) | $9,933 | $21,568 |
| Standard Deviation (Sample) | $7,373 | $15,536 |
| Standard Deviation (Population) | $7,321 | $15,324 |
Similar Demographics by Median Male Earnings
Demographics Similar to Hondurans by Median Male Earnings
In terms of median male earnings, the demographic groups most similar to Hondurans are Chippewa ($46,368, a difference of 0.010%), Hispanic or Latino ($46,419, a difference of 0.10%), Apache ($46,429, a difference of 0.12%), Immigrants from Guatemala ($46,244, a difference of 0.28%), and Immigrants from Caribbean ($46,193, a difference of 0.39%).
| Demographics | Rating | Rank | Median Male Earnings |
| Dutch West Indians | 0.0 /100 | #306 | Tragic $46,656 |
| Immigrants | Dominican Republic | 0.0 /100 | #307 | Tragic $46,655 |
| Ottawa | 0.0 /100 | #308 | Tragic $46,611 |
| Creek | 0.0 /100 | #309 | Tragic $46,594 |
| Cubans | 0.0 /100 | #310 | Tragic $46,580 |
| Apache | 0.0 /100 | #311 | Tragic $46,429 |
| Hispanics or Latinos | 0.0 /100 | #312 | Tragic $46,419 |
| Hondurans | 0.0 /100 | #313 | Tragic $46,374 |
| Chippewa | 0.0 /100 | #314 | Tragic $46,368 |
| Immigrants | Guatemala | 0.0 /100 | #315 | Tragic $46,244 |
| Immigrants | Caribbean | 0.0 /100 | #316 | Tragic $46,193 |
| Mexicans | 0.0 /100 | #317 | Tragic $46,147 |
| Cheyenne | 0.0 /100 | #318 | Tragic $46,062 |
| Haitians | 0.0 /100 | #319 | Tragic $45,903 |
| Immigrants | Honduras | 0.0 /100 | #320 | Tragic $45,787 |
Demographics Similar to Shoshone by Median Male Earnings
In terms of median male earnings, the demographic groups most similar to Shoshone are Immigrants from El Salvador ($47,973, a difference of 0.090%), Mexican American Indian ($47,990, a difference of 0.12%), African ($47,994, a difference of 0.13%), Paiute ($47,991, a difference of 0.13%), and Chickasaw ($47,832, a difference of 0.21%).
| Demographics | Rating | Rank | Median Male Earnings |
| Marshallese | 0.2 /100 | #281 | Tragic $48,137 |
| Central Americans | 0.2 /100 | #282 | Tragic $48,093 |
| Immigrants | Jamaica | 0.2 /100 | #283 | Tragic $48,040 |
| Africans | 0.2 /100 | #284 | Tragic $47,994 |
| Paiute | 0.2 /100 | #285 | Tragic $47,991 |
| Mexican American Indians | 0.2 /100 | #286 | Tragic $47,990 |
| Immigrants | El Salvador | 0.2 /100 | #287 | Tragic $47,973 |
| Shoshone | 0.2 /100 | #288 | Tragic $47,930 |
| Chickasaw | 0.1 /100 | #289 | Tragic $47,832 |
| Immigrants | Belize | 0.1 /100 | #290 | Tragic $47,809 |
| Choctaw | 0.1 /100 | #291 | Tragic $47,729 |
| Immigrants | Dominica | 0.1 /100 | #292 | Tragic $47,651 |
| Indonesians | 0.1 /100 | #293 | Tragic $47,503 |
| Immigrants | Nicaragua | 0.1 /100 | #294 | Tragic $47,482 |
| Central American Indians | 0.1 /100 | #295 | Tragic $47,433 |