Scandinavian vs Immigrants from Middle Africa Median Earnings
COMPARE
Scandinavian
Immigrants from Middle Africa
Median Earnings
Median Earnings Comparison
Scandinavians
Immigrants from Middle Africa
$46,433
MEDIAN EARNINGS
50.0/ 100
METRIC RATING
174th/ 347
METRIC RANK
$43,416
MEDIAN EARNINGS
1.4/ 100
METRIC RATING
255th/ 347
METRIC RANK
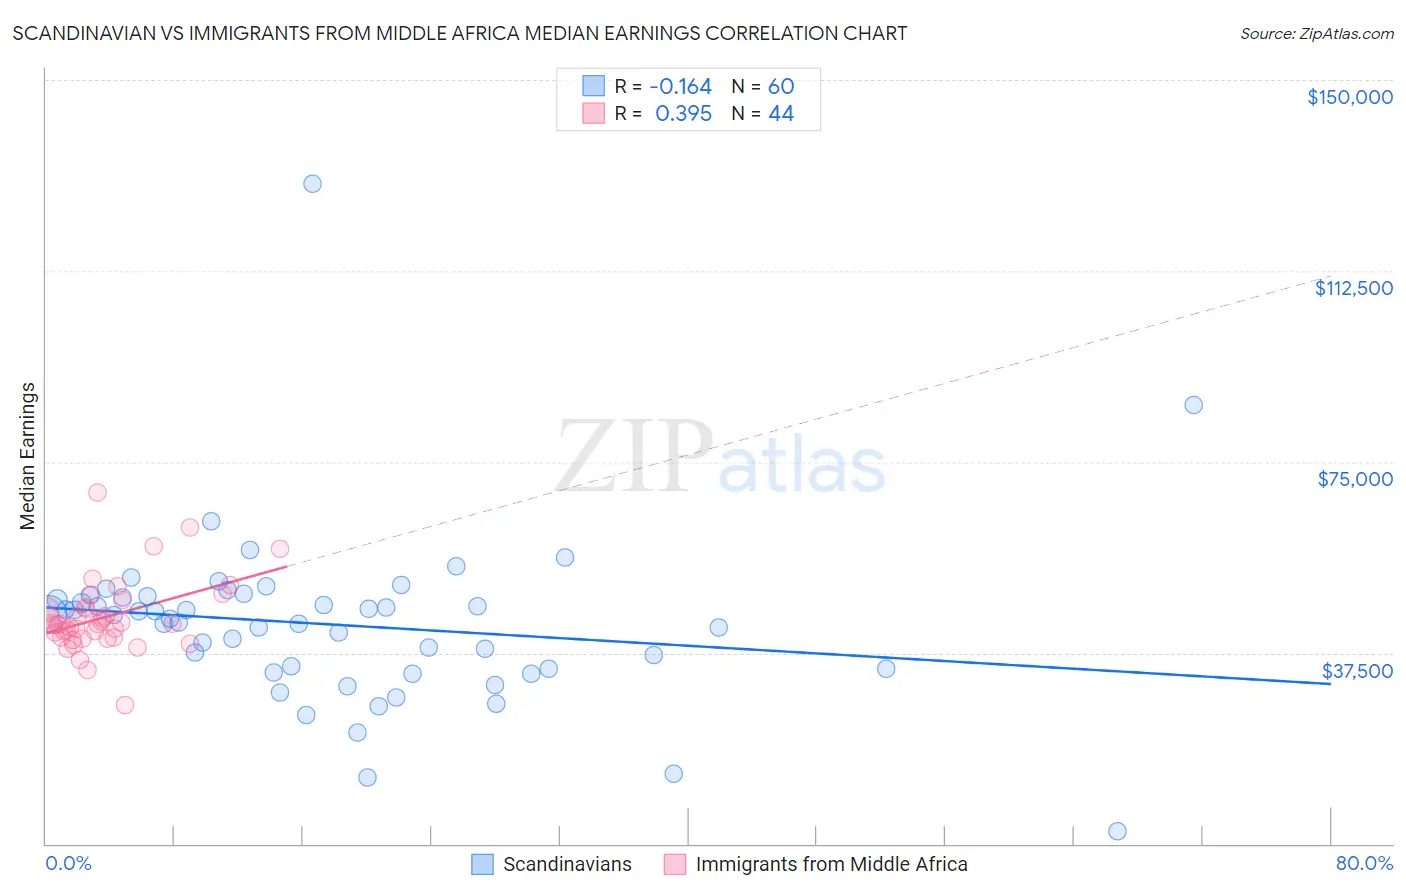
Scandinavian vs Immigrants from Middle Africa Median Earnings Correlation Chart
The statistical analysis conducted on geographies consisting of 472,554,301 people shows a poor negative correlation between the proportion of Scandinavians and median earnings in the United States with a correlation coefficient (R) of -0.164 and weighted average of $46,433. Similarly, the statistical analysis conducted on geographies consisting of 202,728,521 people shows a mild positive correlation between the proportion of Immigrants from Middle Africa and median earnings in the United States with a correlation coefficient (R) of 0.395 and weighted average of $43,416, a difference of 7.0%.
Median Earnings Correlation Summary
| Measurement | Scandinavian | Immigrants from Middle Africa |
| Minimum | $2,499 | $27,307 |
| Maximum | $129,652 | $68,894 |
| Range | $127,153 | $41,587 |
| Mean | $43,051 | $44,490 |
| Median | $44,555 | $43,158 |
| Interquartile 25% (IQ1) | $34,442 | $40,556 |
| Interquartile 75% (IQ3) | $48,536 | $46,358 |
| Interquartile Range (IQR) | $14,094 | $5,802 |
| Standard Deviation (Sample) | $16,928 | $7,197 |
| Standard Deviation (Population) | $16,786 | $7,115 |
Similar Demographics by Median Earnings
Demographics Similar to Scandinavians by Median Earnings
In terms of median earnings, the demographic groups most similar to Scandinavians are Ghanaian ($46,440, a difference of 0.020%), Scottish ($46,463, a difference of 0.060%), Kenyan ($46,462, a difference of 0.060%), Basque ($46,399, a difference of 0.070%), and Danish ($46,392, a difference of 0.090%).
| Demographics | Rating | Rank | Median Earnings |
| Costa Ricans | 57.4 /100 | #167 | Average $46,645 |
| Immigrants | Africa | 54.6 /100 | #168 | Average $46,564 |
| Immigrants | South America | 54.0 /100 | #169 | Average $46,548 |
| Immigrants | Immigrants | 51.6 /100 | #170 | Average $46,478 |
| Scottish | 51.1 /100 | #171 | Average $46,463 |
| Kenyans | 51.0 /100 | #172 | Average $46,462 |
| Ghanaians | 50.3 /100 | #173 | Average $46,440 |
| Scandinavians | 50.0 /100 | #174 | Average $46,433 |
| Basques | 48.8 /100 | #175 | Average $46,399 |
| Danes | 48.6 /100 | #176 | Average $46,392 |
| Belgians | 48.0 /100 | #177 | Average $46,375 |
| Colombians | 47.1 /100 | #178 | Average $46,349 |
| English | 46.5 /100 | #179 | Average $46,334 |
| Puget Sound Salish | 46.5 /100 | #180 | Average $46,333 |
| Immigrants | Cameroon | 46.4 /100 | #181 | Average $46,329 |
Demographics Similar to Immigrants from Middle Africa by Median Earnings
In terms of median earnings, the demographic groups most similar to Immigrants from Middle Africa are Alaskan Athabascan ($43,393, a difference of 0.050%), Jamaican ($43,343, a difference of 0.17%), French American Indian ($43,333, a difference of 0.19%), Liberian ($43,536, a difference of 0.28%), and Somali ($43,567, a difference of 0.35%).
| Demographics | Rating | Rank | Median Earnings |
| Nepalese | 2.6 /100 | #248 | Tragic $43,860 |
| Malaysians | 2.6 /100 | #249 | Tragic $43,844 |
| Alaska Natives | 2.3 /100 | #250 | Tragic $43,750 |
| Tsimshian | 2.1 /100 | #251 | Tragic $43,695 |
| Hawaiians | 2.0 /100 | #252 | Tragic $43,673 |
| Somalis | 1.8 /100 | #253 | Tragic $43,567 |
| Liberians | 1.7 /100 | #254 | Tragic $43,536 |
| Immigrants | Middle Africa | 1.4 /100 | #255 | Tragic $43,416 |
| Alaskan Athabascans | 1.4 /100 | #256 | Tragic $43,393 |
| Jamaicans | 1.3 /100 | #257 | Tragic $43,343 |
| French American Indians | 1.3 /100 | #258 | Tragic $43,333 |
| German Russians | 1.1 /100 | #259 | Tragic $43,200 |
| Immigrants | Somalia | 0.9 /100 | #260 | Tragic $43,100 |
| Immigrants | Jamaica | 0.8 /100 | #261 | Tragic $43,026 |
| Nicaraguans | 0.8 /100 | #262 | Tragic $43,026 |