Scandinavian vs Immigrants from Chile Median Earnings
COMPARE
Scandinavian
Immigrants from Chile
Median Earnings
Median Earnings Comparison
Scandinavians
Immigrants from Chile
$46,433
MEDIAN EARNINGS
50.0/ 100
METRIC RATING
174th/ 347
METRIC RANK
$47,697
MEDIAN EARNINGS
85.5/ 100
METRIC RATING
146th/ 347
METRIC RANK
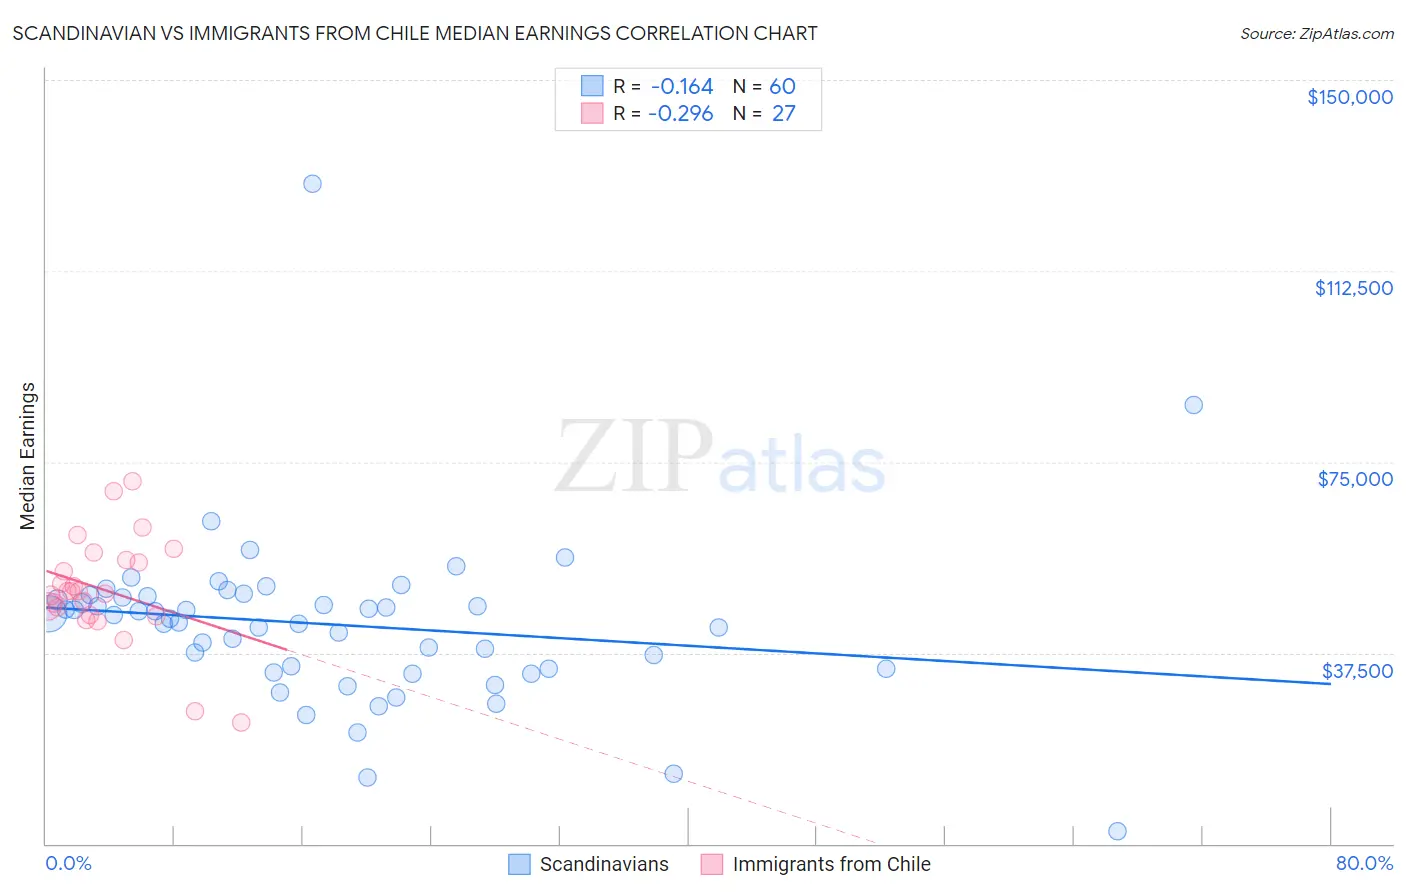
Scandinavian vs Immigrants from Chile Median Earnings Correlation Chart
The statistical analysis conducted on geographies consisting of 472,554,301 people shows a poor negative correlation between the proportion of Scandinavians and median earnings in the United States with a correlation coefficient (R) of -0.164 and weighted average of $46,433. Similarly, the statistical analysis conducted on geographies consisting of 218,645,469 people shows a weak negative correlation between the proportion of Immigrants from Chile and median earnings in the United States with a correlation coefficient (R) of -0.296 and weighted average of $47,697, a difference of 2.7%.
Median Earnings Correlation Summary
| Measurement | Scandinavian | Immigrants from Chile |
| Minimum | $2,499 | $23,911 |
| Maximum | $129,652 | $71,250 |
| Range | $127,153 | $47,339 |
| Mean | $43,051 | $49,886 |
| Median | $44,555 | $49,642 |
| Interquartile 25% (IQ1) | $34,442 | $45,024 |
| Interquartile 75% (IQ3) | $48,536 | $55,791 |
| Interquartile Range (IQR) | $14,094 | $10,767 |
| Standard Deviation (Sample) | $16,928 | $10,356 |
| Standard Deviation (Population) | $16,786 | $10,162 |
Similar Demographics by Median Earnings
Demographics Similar to Scandinavians by Median Earnings
In terms of median earnings, the demographic groups most similar to Scandinavians are Ghanaian ($46,440, a difference of 0.020%), Scottish ($46,463, a difference of 0.060%), Kenyan ($46,462, a difference of 0.060%), Basque ($46,399, a difference of 0.070%), and Danish ($46,392, a difference of 0.090%).
| Demographics | Rating | Rank | Median Earnings |
| Costa Ricans | 57.4 /100 | #167 | Average $46,645 |
| Immigrants | Africa | 54.6 /100 | #168 | Average $46,564 |
| Immigrants | South America | 54.0 /100 | #169 | Average $46,548 |
| Immigrants | Immigrants | 51.6 /100 | #170 | Average $46,478 |
| Scottish | 51.1 /100 | #171 | Average $46,463 |
| Kenyans | 51.0 /100 | #172 | Average $46,462 |
| Ghanaians | 50.3 /100 | #173 | Average $46,440 |
| Scandinavians | 50.0 /100 | #174 | Average $46,433 |
| Basques | 48.8 /100 | #175 | Average $46,399 |
| Danes | 48.6 /100 | #176 | Average $46,392 |
| Belgians | 48.0 /100 | #177 | Average $46,375 |
| Colombians | 47.1 /100 | #178 | Average $46,349 |
| English | 46.5 /100 | #179 | Average $46,334 |
| Puget Sound Salish | 46.5 /100 | #180 | Average $46,333 |
| Immigrants | Cameroon | 46.4 /100 | #181 | Average $46,329 |
Demographics Similar to Immigrants from Chile by Median Earnings
In terms of median earnings, the demographic groups most similar to Immigrants from Chile are Immigrants from Saudi Arabia ($47,704, a difference of 0.010%), Immigrants from South Eastern Asia ($47,671, a difference of 0.060%), Immigrants from Eritrea ($47,657, a difference of 0.080%), Luxembourger ($47,640, a difference of 0.12%), and Peruvian ($47,628, a difference of 0.15%).
| Demographics | Rating | Rank | Median Earnings |
| Canadians | 88.8 /100 | #139 | Excellent $47,911 |
| Taiwanese | 88.7 /100 | #140 | Excellent $47,902 |
| Immigrants | Sierra Leone | 88.3 /100 | #141 | Excellent $47,875 |
| Ugandans | 88.0 /100 | #142 | Excellent $47,854 |
| Swedes | 88.0 /100 | #143 | Excellent $47,851 |
| Hungarians | 87.1 /100 | #144 | Excellent $47,795 |
| Immigrants | Saudi Arabia | 85.6 /100 | #145 | Excellent $47,704 |
| Immigrants | Chile | 85.5 /100 | #146 | Excellent $47,697 |
| Immigrants | South Eastern Asia | 85.0 /100 | #147 | Excellent $47,671 |
| Immigrants | Eritrea | 84.8 /100 | #148 | Excellent $47,657 |
| Luxembourgers | 84.5 /100 | #149 | Excellent $47,640 |
| Peruvians | 84.2 /100 | #150 | Excellent $47,628 |
| Immigrants | Oceania | 84.1 /100 | #151 | Excellent $47,617 |
| Immigrants | Germany | 83.1 /100 | #152 | Excellent $47,566 |
| Slavs | 81.1 /100 | #153 | Excellent $47,470 |