Honduran vs Immigrants from Middle Africa Median Earnings
COMPARE
Honduran
Immigrants from Middle Africa
Median Earnings
Median Earnings Comparison
Hondurans
Immigrants from Middle Africa
$40,638
MEDIAN EARNINGS
0.0/ 100
METRIC RATING
307th/ 347
METRIC RANK
$43,416
MEDIAN EARNINGS
1.4/ 100
METRIC RATING
255th/ 347
METRIC RANK
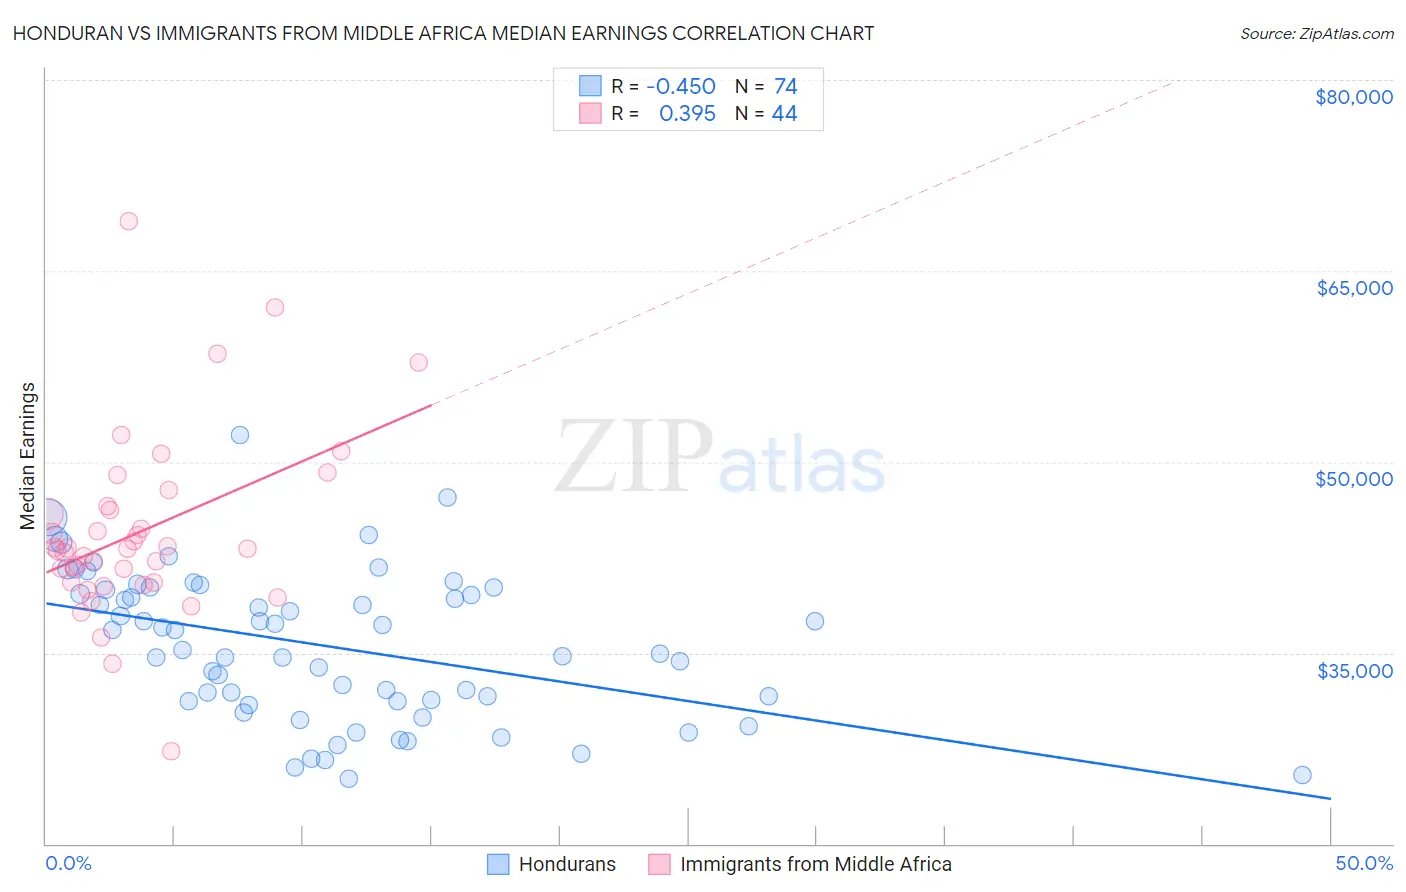
Honduran vs Immigrants from Middle Africa Median Earnings Correlation Chart
The statistical analysis conducted on geographies consisting of 357,850,602 people shows a moderate negative correlation between the proportion of Hondurans and median earnings in the United States with a correlation coefficient (R) of -0.450 and weighted average of $40,638. Similarly, the statistical analysis conducted on geographies consisting of 202,728,521 people shows a mild positive correlation between the proportion of Immigrants from Middle Africa and median earnings in the United States with a correlation coefficient (R) of 0.395 and weighted average of $43,416, a difference of 6.8%.
Median Earnings Correlation Summary
| Measurement | Honduran | Immigrants from Middle Africa |
| Minimum | $25,151 | $27,307 |
| Maximum | $52,125 | $68,894 |
| Range | $26,974 | $41,587 |
| Mean | $35,597 | $44,490 |
| Median | $35,991 | $43,158 |
| Interquartile 25% (IQ1) | $31,224 | $40,556 |
| Interquartile 75% (IQ3) | $39,973 | $46,358 |
| Interquartile Range (IQR) | $8,749 | $5,802 |
| Standard Deviation (Sample) | $5,768 | $7,197 |
| Standard Deviation (Population) | $5,729 | $7,115 |
Similar Demographics by Median Earnings
Demographics Similar to Hondurans by Median Earnings
In terms of median earnings, the demographic groups most similar to Hondurans are Yaqui ($40,647, a difference of 0.020%), Cuban ($40,619, a difference of 0.050%), Chickasaw ($40,672, a difference of 0.080%), Immigrants from Haiti ($40,550, a difference of 0.22%), and Immigrants from Guatemala ($40,851, a difference of 0.52%).
| Demographics | Rating | Rank | Median Earnings |
| Ute | 0.1 /100 | #300 | Tragic $41,051 |
| Immigrants | Latin America | 0.1 /100 | #301 | Tragic $41,049 |
| Shoshone | 0.0 /100 | #302 | Tragic $40,932 |
| Haitians | 0.0 /100 | #303 | Tragic $40,918 |
| Immigrants | Guatemala | 0.0 /100 | #304 | Tragic $40,851 |
| Chickasaw | 0.0 /100 | #305 | Tragic $40,672 |
| Yaqui | 0.0 /100 | #306 | Tragic $40,647 |
| Hondurans | 0.0 /100 | #307 | Tragic $40,638 |
| Cubans | 0.0 /100 | #308 | Tragic $40,619 |
| Immigrants | Haiti | 0.0 /100 | #309 | Tragic $40,550 |
| Apache | 0.0 /100 | #310 | Tragic $40,388 |
| Hispanics or Latinos | 0.0 /100 | #311 | Tragic $40,288 |
| Chippewa | 0.0 /100 | #312 | Tragic $40,287 |
| Choctaw | 0.0 /100 | #313 | Tragic $40,270 |
| Cheyenne | 0.0 /100 | #314 | Tragic $40,233 |
Demographics Similar to Immigrants from Middle Africa by Median Earnings
In terms of median earnings, the demographic groups most similar to Immigrants from Middle Africa are Alaskan Athabascan ($43,393, a difference of 0.050%), Jamaican ($43,343, a difference of 0.17%), French American Indian ($43,333, a difference of 0.19%), Liberian ($43,536, a difference of 0.28%), and Somali ($43,567, a difference of 0.35%).
| Demographics | Rating | Rank | Median Earnings |
| Nepalese | 2.6 /100 | #248 | Tragic $43,860 |
| Malaysians | 2.6 /100 | #249 | Tragic $43,844 |
| Alaska Natives | 2.3 /100 | #250 | Tragic $43,750 |
| Tsimshian | 2.1 /100 | #251 | Tragic $43,695 |
| Hawaiians | 2.0 /100 | #252 | Tragic $43,673 |
| Somalis | 1.8 /100 | #253 | Tragic $43,567 |
| Liberians | 1.7 /100 | #254 | Tragic $43,536 |
| Immigrants | Middle Africa | 1.4 /100 | #255 | Tragic $43,416 |
| Alaskan Athabascans | 1.4 /100 | #256 | Tragic $43,393 |
| Jamaicans | 1.3 /100 | #257 | Tragic $43,343 |
| French American Indians | 1.3 /100 | #258 | Tragic $43,333 |
| German Russians | 1.1 /100 | #259 | Tragic $43,200 |
| Immigrants | Somalia | 0.9 /100 | #260 | Tragic $43,100 |
| Immigrants | Jamaica | 0.8 /100 | #261 | Tragic $43,026 |
| Nicaraguans | 0.8 /100 | #262 | Tragic $43,026 |