Scandinavian vs Immigrants from Greece Median Earnings
COMPARE
Scandinavian
Immigrants from Greece
Median Earnings
Median Earnings Comparison
Scandinavians
Immigrants from Greece
$46,433
MEDIAN EARNINGS
50.0/ 100
METRIC RATING
174th/ 347
METRIC RANK
$53,282
MEDIAN EARNINGS
100.0/ 100
METRIC RATING
33rd/ 347
METRIC RANK
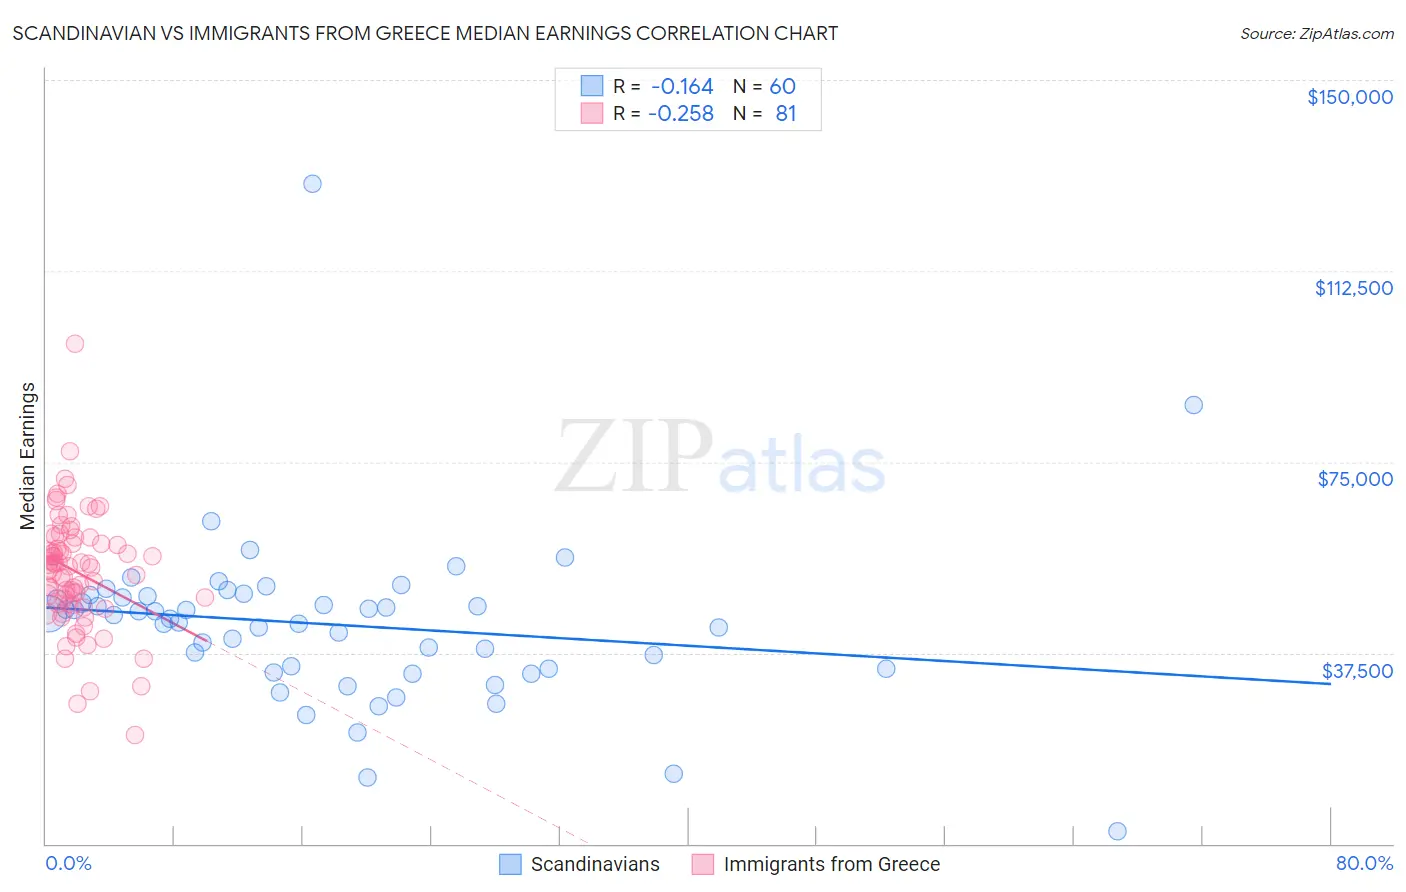
Scandinavian vs Immigrants from Greece Median Earnings Correlation Chart
The statistical analysis conducted on geographies consisting of 472,554,301 people shows a poor negative correlation between the proportion of Scandinavians and median earnings in the United States with a correlation coefficient (R) of -0.164 and weighted average of $46,433. Similarly, the statistical analysis conducted on geographies consisting of 216,859,908 people shows a weak negative correlation between the proportion of Immigrants from Greece and median earnings in the United States with a correlation coefficient (R) of -0.258 and weighted average of $53,282, a difference of 14.7%.
Median Earnings Correlation Summary
| Measurement | Scandinavian | Immigrants from Greece |
| Minimum | $2,499 | $21,296 |
| Maximum | $129,652 | $98,167 |
| Range | $127,153 | $76,871 |
| Mean | $43,051 | $53,424 |
| Median | $44,555 | $54,495 |
| Interquartile 25% (IQ1) | $34,442 | $47,153 |
| Interquartile 75% (IQ3) | $48,536 | $59,515 |
| Interquartile Range (IQR) | $14,094 | $12,362 |
| Standard Deviation (Sample) | $16,928 | $11,394 |
| Standard Deviation (Population) | $16,786 | $11,323 |
Similar Demographics by Median Earnings
Demographics Similar to Scandinavians by Median Earnings
In terms of median earnings, the demographic groups most similar to Scandinavians are Ghanaian ($46,440, a difference of 0.020%), Scottish ($46,463, a difference of 0.060%), Kenyan ($46,462, a difference of 0.060%), Basque ($46,399, a difference of 0.070%), and Danish ($46,392, a difference of 0.090%).
| Demographics | Rating | Rank | Median Earnings |
| Costa Ricans | 57.4 /100 | #167 | Average $46,645 |
| Immigrants | Africa | 54.6 /100 | #168 | Average $46,564 |
| Immigrants | South America | 54.0 /100 | #169 | Average $46,548 |
| Immigrants | Immigrants | 51.6 /100 | #170 | Average $46,478 |
| Scottish | 51.1 /100 | #171 | Average $46,463 |
| Kenyans | 51.0 /100 | #172 | Average $46,462 |
| Ghanaians | 50.3 /100 | #173 | Average $46,440 |
| Scandinavians | 50.0 /100 | #174 | Average $46,433 |
| Basques | 48.8 /100 | #175 | Average $46,399 |
| Danes | 48.6 /100 | #176 | Average $46,392 |
| Belgians | 48.0 /100 | #177 | Average $46,375 |
| Colombians | 47.1 /100 | #178 | Average $46,349 |
| English | 46.5 /100 | #179 | Average $46,334 |
| Puget Sound Salish | 46.5 /100 | #180 | Average $46,333 |
| Immigrants | Cameroon | 46.4 /100 | #181 | Average $46,329 |
Demographics Similar to Immigrants from Greece by Median Earnings
In terms of median earnings, the demographic groups most similar to Immigrants from Greece are Immigrants from Sri Lanka ($53,268, a difference of 0.030%), Immigrants from Asia ($53,310, a difference of 0.050%), Russian ($53,334, a difference of 0.10%), Immigrants from Switzerland ($53,211, a difference of 0.13%), and Immigrants from Denmark ($53,186, a difference of 0.18%).
| Demographics | Rating | Rank | Median Earnings |
| Immigrants | Northern Europe | 100.0 /100 | #26 | Exceptional $53,872 |
| Asians | 100.0 /100 | #27 | Exceptional $53,690 |
| Immigrants | France | 100.0 /100 | #28 | Exceptional $53,490 |
| Immigrants | Russia | 100.0 /100 | #29 | Exceptional $53,457 |
| Cambodians | 100.0 /100 | #30 | Exceptional $53,386 |
| Russians | 100.0 /100 | #31 | Exceptional $53,334 |
| Immigrants | Asia | 100.0 /100 | #32 | Exceptional $53,310 |
| Immigrants | Greece | 100.0 /100 | #33 | Exceptional $53,282 |
| Immigrants | Sri Lanka | 100.0 /100 | #34 | Exceptional $53,268 |
| Immigrants | Switzerland | 100.0 /100 | #35 | Exceptional $53,211 |
| Immigrants | Denmark | 100.0 /100 | #36 | Exceptional $53,186 |
| Immigrants | Belarus | 100.0 /100 | #37 | Exceptional $53,043 |
| Latvians | 100.0 /100 | #38 | Exceptional $53,001 |
| Immigrants | Turkey | 100.0 /100 | #39 | Exceptional $52,960 |
| Israelis | 100.0 /100 | #40 | Exceptional $52,937 |