Cypriot vs Immigrants from Middle Africa Median Earnings
COMPARE
Cypriot
Immigrants from Middle Africa
Median Earnings
Median Earnings Comparison
Cypriots
Immigrants from Middle Africa
$54,589
MEDIAN EARNINGS
100.0/ 100
METRIC RATING
20th/ 347
METRIC RANK
$43,416
MEDIAN EARNINGS
1.4/ 100
METRIC RATING
255th/ 347
METRIC RANK
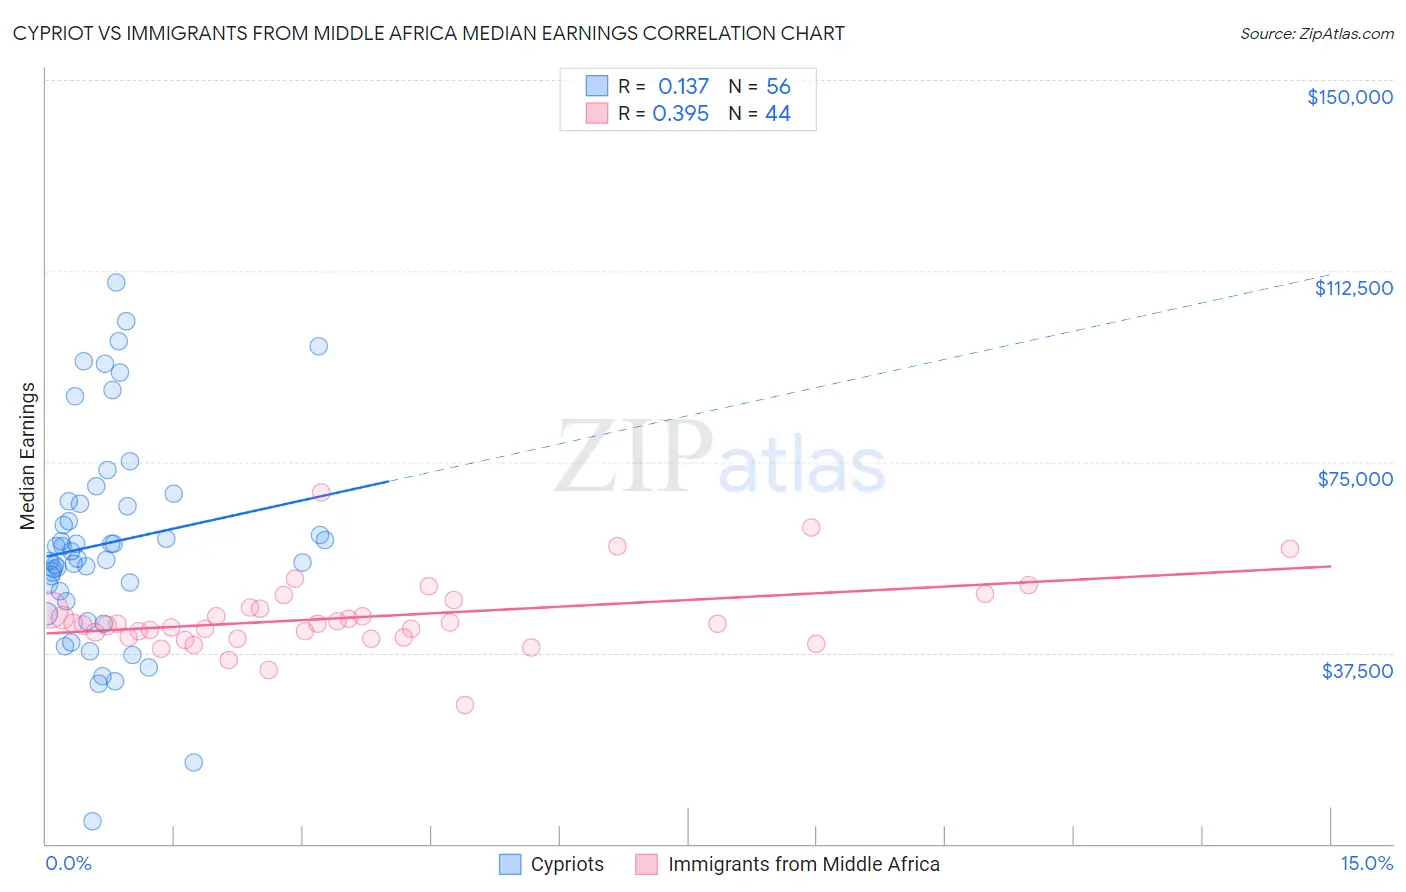
Cypriot vs Immigrants from Middle Africa Median Earnings Correlation Chart
The statistical analysis conducted on geographies consisting of 61,853,771 people shows a poor positive correlation between the proportion of Cypriots and median earnings in the United States with a correlation coefficient (R) of 0.137 and weighted average of $54,589. Similarly, the statistical analysis conducted on geographies consisting of 202,728,521 people shows a mild positive correlation between the proportion of Immigrants from Middle Africa and median earnings in the United States with a correlation coefficient (R) of 0.395 and weighted average of $43,416, a difference of 25.7%.
Median Earnings Correlation Summary
| Measurement | Cypriot | Immigrants from Middle Africa |
| Minimum | $4,333 | $27,307 |
| Maximum | $110,295 | $68,894 |
| Range | $105,962 | $41,587 |
| Mean | $59,088 | $44,490 |
| Median | $56,710 | $43,158 |
| Interquartile 25% (IQ1) | $48,668 | $40,556 |
| Interquartile 75% (IQ3) | $66,958 | $46,358 |
| Interquartile Range (IQR) | $18,291 | $5,802 |
| Standard Deviation (Sample) | $21,103 | $7,197 |
| Standard Deviation (Population) | $20,914 | $7,115 |
Similar Demographics by Median Earnings
Demographics Similar to Cypriots by Median Earnings
In terms of median earnings, the demographic groups most similar to Cypriots are Burmese ($54,559, a difference of 0.060%), Immigrants from Korea ($54,530, a difference of 0.11%), Immigrants from Belgium ($54,679, a difference of 0.16%), Immigrants from Sweden ($54,478, a difference of 0.20%), and Soviet Union ($54,290, a difference of 0.55%).
| Demographics | Rating | Rank | Median Earnings |
| Immigrants | China | 100.0 /100 | #13 | Exceptional $56,638 |
| Immigrants | Australia | 100.0 /100 | #14 | Exceptional $56,305 |
| Indians (Asian) | 100.0 /100 | #15 | Exceptional $56,253 |
| Immigrants | Eastern Asia | 100.0 /100 | #16 | Exceptional $56,183 |
| Eastern Europeans | 100.0 /100 | #17 | Exceptional $55,084 |
| Immigrants | Japan | 100.0 /100 | #18 | Exceptional $54,938 |
| Immigrants | Belgium | 100.0 /100 | #19 | Exceptional $54,679 |
| Cypriots | 100.0 /100 | #20 | Exceptional $54,589 |
| Burmese | 100.0 /100 | #21 | Exceptional $54,559 |
| Immigrants | Korea | 100.0 /100 | #22 | Exceptional $54,530 |
| Immigrants | Sweden | 100.0 /100 | #23 | Exceptional $54,478 |
| Soviet Union | 100.0 /100 | #24 | Exceptional $54,290 |
| Turks | 100.0 /100 | #25 | Exceptional $53,919 |
| Immigrants | Northern Europe | 100.0 /100 | #26 | Exceptional $53,872 |
| Asians | 100.0 /100 | #27 | Exceptional $53,690 |
Demographics Similar to Immigrants from Middle Africa by Median Earnings
In terms of median earnings, the demographic groups most similar to Immigrants from Middle Africa are Alaskan Athabascan ($43,393, a difference of 0.050%), Jamaican ($43,343, a difference of 0.17%), French American Indian ($43,333, a difference of 0.19%), Liberian ($43,536, a difference of 0.28%), and Somali ($43,567, a difference of 0.35%).
| Demographics | Rating | Rank | Median Earnings |
| Nepalese | 2.6 /100 | #248 | Tragic $43,860 |
| Malaysians | 2.6 /100 | #249 | Tragic $43,844 |
| Alaska Natives | 2.3 /100 | #250 | Tragic $43,750 |
| Tsimshian | 2.1 /100 | #251 | Tragic $43,695 |
| Hawaiians | 2.0 /100 | #252 | Tragic $43,673 |
| Somalis | 1.8 /100 | #253 | Tragic $43,567 |
| Liberians | 1.7 /100 | #254 | Tragic $43,536 |
| Immigrants | Middle Africa | 1.4 /100 | #255 | Tragic $43,416 |
| Alaskan Athabascans | 1.4 /100 | #256 | Tragic $43,393 |
| Jamaicans | 1.3 /100 | #257 | Tragic $43,343 |
| French American Indians | 1.3 /100 | #258 | Tragic $43,333 |
| German Russians | 1.1 /100 | #259 | Tragic $43,200 |
| Immigrants | Somalia | 0.9 /100 | #260 | Tragic $43,100 |
| Immigrants | Jamaica | 0.8 /100 | #261 | Tragic $43,026 |
| Nicaraguans | 0.8 /100 | #262 | Tragic $43,026 |