Spanish American vs Immigrants from Middle Africa Median Earnings
COMPARE
Spanish American
Immigrants from Middle Africa
Median Earnings
Median Earnings Comparison
Spanish Americans
Immigrants from Middle Africa
$42,316
MEDIAN EARNINGS
0.3/ 100
METRIC RATING
276th/ 347
METRIC RANK
$43,416
MEDIAN EARNINGS
1.4/ 100
METRIC RATING
255th/ 347
METRIC RANK
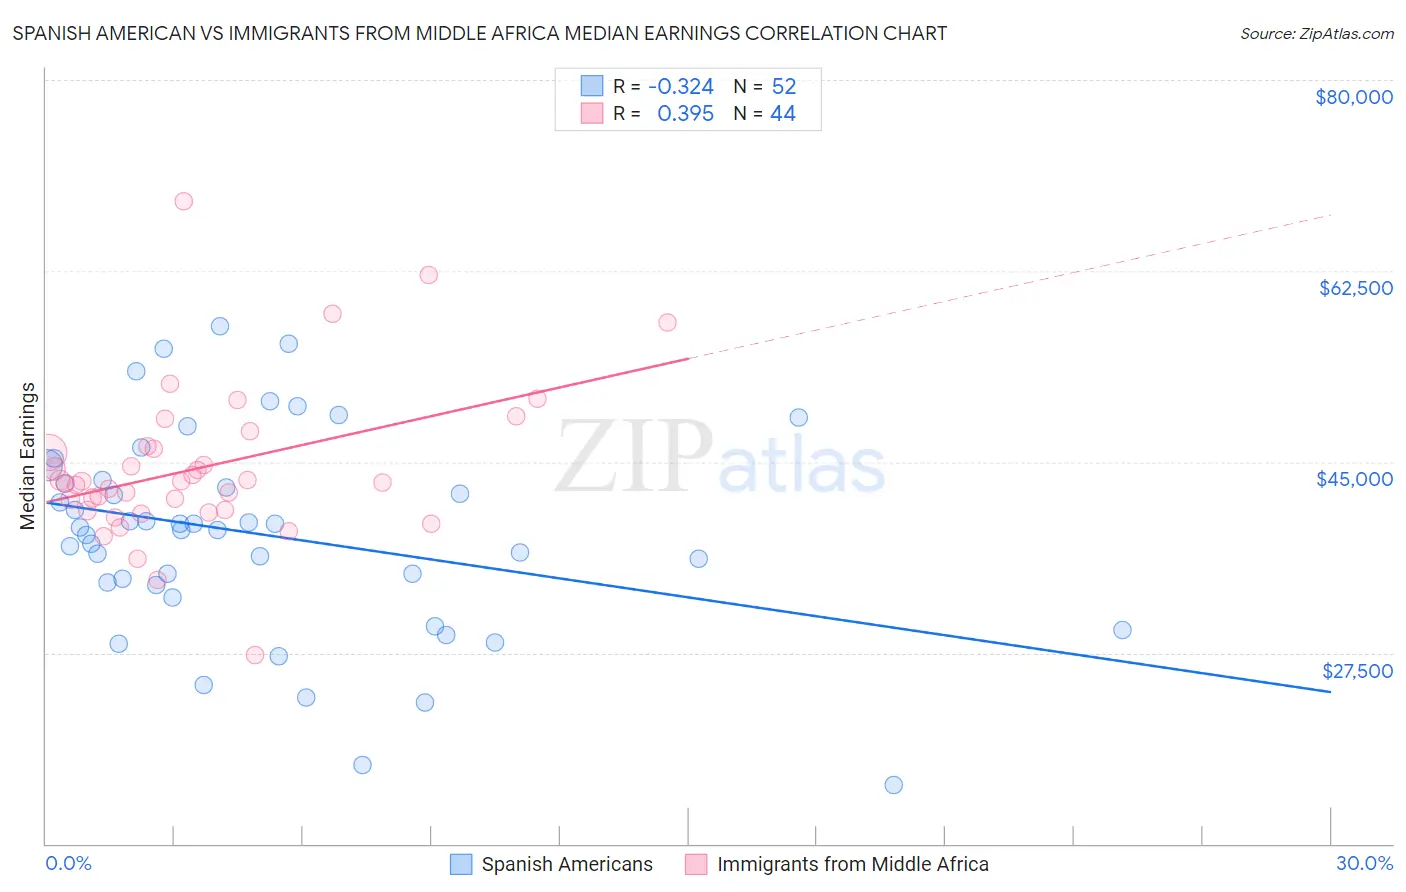
Spanish American vs Immigrants from Middle Africa Median Earnings Correlation Chart
The statistical analysis conducted on geographies consisting of 103,163,926 people shows a mild negative correlation between the proportion of Spanish Americans and median earnings in the United States with a correlation coefficient (R) of -0.324 and weighted average of $42,316. Similarly, the statistical analysis conducted on geographies consisting of 202,728,521 people shows a mild positive correlation between the proportion of Immigrants from Middle Africa and median earnings in the United States with a correlation coefficient (R) of 0.395 and weighted average of $43,416, a difference of 2.6%.
Median Earnings Correlation Summary
| Measurement | Spanish American | Immigrants from Middle Africa |
| Minimum | $15,345 | $27,307 |
| Maximum | $57,404 | $68,894 |
| Range | $42,059 | $41,587 |
| Mean | $38,311 | $44,490 |
| Median | $38,863 | $43,158 |
| Interquartile 25% (IQ1) | $33,792 | $40,556 |
| Interquartile 75% (IQ3) | $43,155 | $46,358 |
| Interquartile Range (IQR) | $9,363 | $5,802 |
| Standard Deviation (Sample) | $9,272 | $7,197 |
| Standard Deviation (Population) | $9,182 | $7,115 |
Similar Demographics by Median Earnings
Demographics Similar to Spanish Americans by Median Earnings
In terms of median earnings, the demographic groups most similar to Spanish Americans are Immigrants from Belize ($42,339, a difference of 0.060%), Central American ($42,280, a difference of 0.090%), Immigrants from El Salvador ($42,413, a difference of 0.23%), Immigrants from Dominica ($42,420, a difference of 0.25%), and Iroquois ($42,430, a difference of 0.27%).
| Demographics | Rating | Rank | Median Earnings |
| Belizeans | 0.5 /100 | #269 | Tragic $42,702 |
| Osage | 0.5 /100 | #270 | Tragic $42,651 |
| Pennsylvania Germans | 0.5 /100 | #271 | Tragic $42,615 |
| Iroquois | 0.4 /100 | #272 | Tragic $42,430 |
| Immigrants | Dominica | 0.4 /100 | #273 | Tragic $42,420 |
| Immigrants | El Salvador | 0.4 /100 | #274 | Tragic $42,413 |
| Immigrants | Belize | 0.3 /100 | #275 | Tragic $42,339 |
| Spanish Americans | 0.3 /100 | #276 | Tragic $42,316 |
| Central Americans | 0.3 /100 | #277 | Tragic $42,280 |
| Cajuns | 0.3 /100 | #278 | Tragic $42,189 |
| Colville | 0.2 /100 | #279 | Tragic $42,151 |
| Hmong | 0.2 /100 | #280 | Tragic $42,111 |
| Marshallese | 0.2 /100 | #281 | Tragic $41,969 |
| Africans | 0.2 /100 | #282 | Tragic $41,955 |
| Dominicans | 0.2 /100 | #283 | Tragic $41,864 |
Demographics Similar to Immigrants from Middle Africa by Median Earnings
In terms of median earnings, the demographic groups most similar to Immigrants from Middle Africa are Alaskan Athabascan ($43,393, a difference of 0.050%), Jamaican ($43,343, a difference of 0.17%), French American Indian ($43,333, a difference of 0.19%), Liberian ($43,536, a difference of 0.28%), and Somali ($43,567, a difference of 0.35%).
| Demographics | Rating | Rank | Median Earnings |
| Nepalese | 2.6 /100 | #248 | Tragic $43,860 |
| Malaysians | 2.6 /100 | #249 | Tragic $43,844 |
| Alaska Natives | 2.3 /100 | #250 | Tragic $43,750 |
| Tsimshian | 2.1 /100 | #251 | Tragic $43,695 |
| Hawaiians | 2.0 /100 | #252 | Tragic $43,673 |
| Somalis | 1.8 /100 | #253 | Tragic $43,567 |
| Liberians | 1.7 /100 | #254 | Tragic $43,536 |
| Immigrants | Middle Africa | 1.4 /100 | #255 | Tragic $43,416 |
| Alaskan Athabascans | 1.4 /100 | #256 | Tragic $43,393 |
| Jamaicans | 1.3 /100 | #257 | Tragic $43,343 |
| French American Indians | 1.3 /100 | #258 | Tragic $43,333 |
| German Russians | 1.1 /100 | #259 | Tragic $43,200 |
| Immigrants | Somalia | 0.9 /100 | #260 | Tragic $43,100 |
| Immigrants | Jamaica | 0.8 /100 | #261 | Tragic $43,026 |
| Nicaraguans | 0.8 /100 | #262 | Tragic $43,026 |