Immigrants from Western Africa vs Immigrants from Middle Africa Median Earnings
COMPARE
Immigrants from Western Africa
Immigrants from Middle Africa
Median Earnings
Median Earnings Comparison
Immigrants from Western Africa
Immigrants from Middle Africa
$44,893
MEDIAN EARNINGS
10.3/ 100
METRIC RATING
230th/ 347
METRIC RANK
$43,416
MEDIAN EARNINGS
1.4/ 100
METRIC RATING
255th/ 347
METRIC RANK
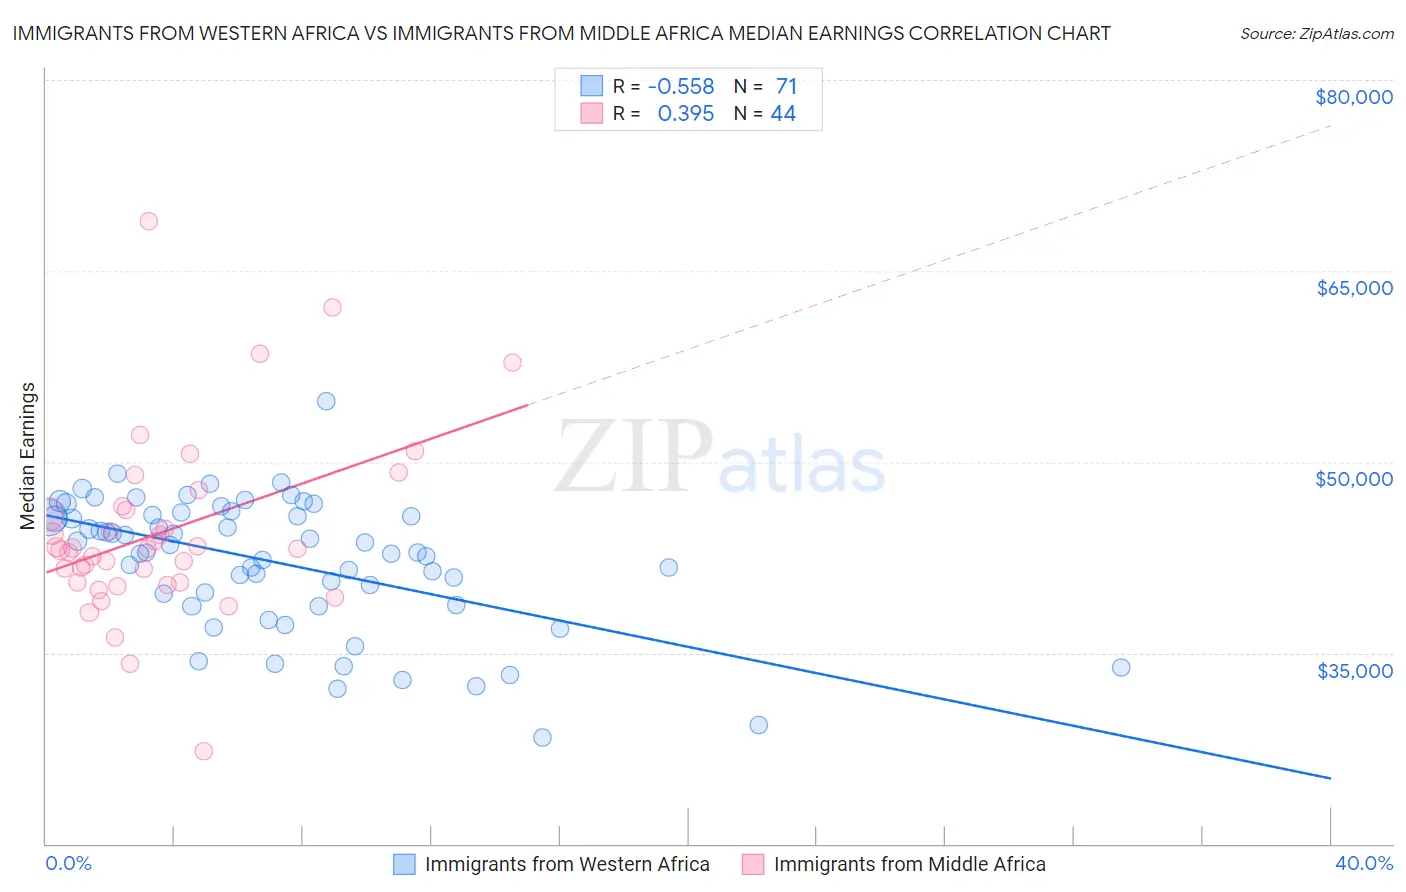
Immigrants from Western Africa vs Immigrants from Middle Africa Median Earnings Correlation Chart
The statistical analysis conducted on geographies consisting of 357,863,895 people shows a substantial negative correlation between the proportion of Immigrants from Western Africa and median earnings in the United States with a correlation coefficient (R) of -0.558 and weighted average of $44,893. Similarly, the statistical analysis conducted on geographies consisting of 202,728,521 people shows a mild positive correlation between the proportion of Immigrants from Middle Africa and median earnings in the United States with a correlation coefficient (R) of 0.395 and weighted average of $43,416, a difference of 3.4%.
Median Earnings Correlation Summary
| Measurement | Immigrants from Western Africa | Immigrants from Middle Africa |
| Minimum | $28,358 | $27,307 |
| Maximum | $54,719 | $68,894 |
| Range | $26,361 | $41,587 |
| Mean | $42,092 | $44,490 |
| Median | $42,904 | $43,158 |
| Interquartile 25% (IQ1) | $38,801 | $40,556 |
| Interquartile 75% (IQ3) | $45,834 | $46,358 |
| Interquartile Range (IQR) | $7,033 | $5,802 |
| Standard Deviation (Sample) | $5,206 | $7,197 |
| Standard Deviation (Population) | $5,170 | $7,115 |
Similar Demographics by Median Earnings
Demographics Similar to Immigrants from Western Africa by Median Earnings
In terms of median earnings, the demographic groups most similar to Immigrants from Western Africa are Scotch-Irish ($44,924, a difference of 0.070%), Japanese ($44,825, a difference of 0.15%), Immigrants from Iraq ($44,988, a difference of 0.21%), Delaware ($44,783, a difference of 0.24%), and Immigrants from Sudan ($44,767, a difference of 0.28%).
| Demographics | Rating | Rank | Median Earnings |
| Whites/Caucasians | 15.0 /100 | #223 | Poor $45,197 |
| West Indians | 13.9 /100 | #224 | Poor $45,132 |
| Immigrants | Cambodia | 13.2 /100 | #225 | Poor $45,090 |
| Immigrants | Nigeria | 12.2 /100 | #226 | Poor $45,030 |
| Native Hawaiians | 12.2 /100 | #227 | Poor $45,027 |
| Immigrants | Iraq | 11.6 /100 | #228 | Poor $44,988 |
| Scotch-Irish | 10.7 /100 | #229 | Poor $44,924 |
| Immigrants | Western Africa | 10.3 /100 | #230 | Poor $44,893 |
| Japanese | 9.5 /100 | #231 | Tragic $44,825 |
| Delaware | 9.0 /100 | #232 | Tragic $44,783 |
| Immigrants | Sudan | 8.8 /100 | #233 | Tragic $44,767 |
| Cape Verdeans | 7.5 /100 | #234 | Tragic $44,640 |
| Venezuelans | 6.9 /100 | #235 | Tragic $44,580 |
| British West Indians | 6.7 /100 | #236 | Tragic $44,552 |
| Immigrants | Ecuador | 5.9 /100 | #237 | Tragic $44,462 |
Demographics Similar to Immigrants from Middle Africa by Median Earnings
In terms of median earnings, the demographic groups most similar to Immigrants from Middle Africa are Alaskan Athabascan ($43,393, a difference of 0.050%), Jamaican ($43,343, a difference of 0.17%), French American Indian ($43,333, a difference of 0.19%), Liberian ($43,536, a difference of 0.28%), and Somali ($43,567, a difference of 0.35%).
| Demographics | Rating | Rank | Median Earnings |
| Nepalese | 2.6 /100 | #248 | Tragic $43,860 |
| Malaysians | 2.6 /100 | #249 | Tragic $43,844 |
| Alaska Natives | 2.3 /100 | #250 | Tragic $43,750 |
| Tsimshian | 2.1 /100 | #251 | Tragic $43,695 |
| Hawaiians | 2.0 /100 | #252 | Tragic $43,673 |
| Somalis | 1.8 /100 | #253 | Tragic $43,567 |
| Liberians | 1.7 /100 | #254 | Tragic $43,536 |
| Immigrants | Middle Africa | 1.4 /100 | #255 | Tragic $43,416 |
| Alaskan Athabascans | 1.4 /100 | #256 | Tragic $43,393 |
| Jamaicans | 1.3 /100 | #257 | Tragic $43,343 |
| French American Indians | 1.3 /100 | #258 | Tragic $43,333 |
| German Russians | 1.1 /100 | #259 | Tragic $43,200 |
| Immigrants | Somalia | 0.9 /100 | #260 | Tragic $43,100 |
| Immigrants | Jamaica | 0.8 /100 | #261 | Tragic $43,026 |
| Nicaraguans | 0.8 /100 | #262 | Tragic $43,026 |