Scandinavian vs Pima Median Earnings
COMPARE
Scandinavian
Pima
Median Earnings
Median Earnings Comparison
Scandinavians
Pima
$46,433
MEDIAN EARNINGS
50.0/ 100
METRIC RATING
174th/ 347
METRIC RANK
$38,285
MEDIAN EARNINGS
0.0/ 100
METRIC RATING
338th/ 347
METRIC RANK
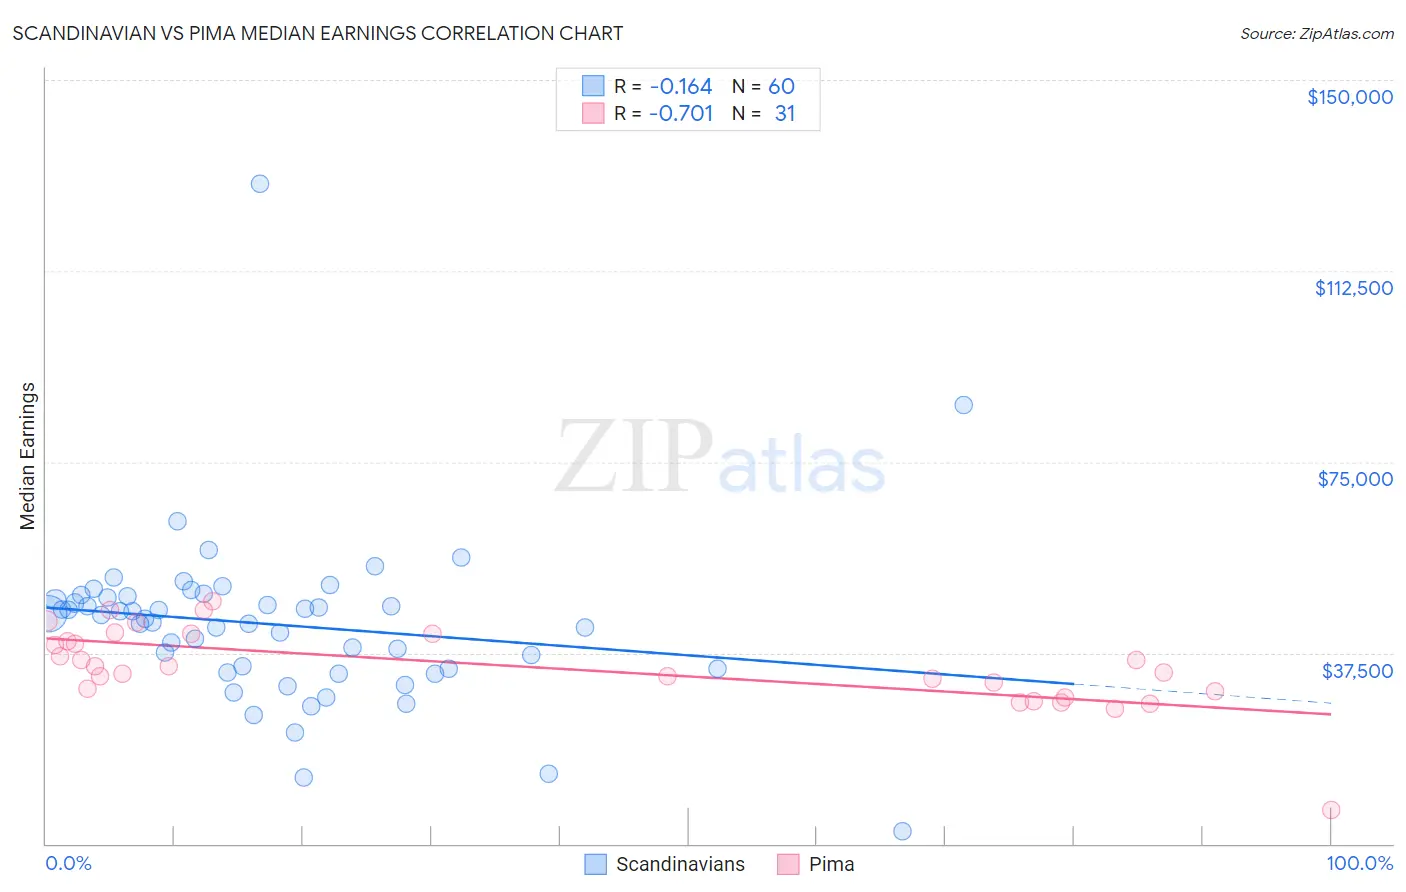
Scandinavian vs Pima Median Earnings Correlation Chart
The statistical analysis conducted on geographies consisting of 472,554,301 people shows a poor negative correlation between the proportion of Scandinavians and median earnings in the United States with a correlation coefficient (R) of -0.164 and weighted average of $46,433. Similarly, the statistical analysis conducted on geographies consisting of 61,551,762 people shows a strong negative correlation between the proportion of Pima and median earnings in the United States with a correlation coefficient (R) of -0.701 and weighted average of $38,285, a difference of 21.3%.
Median Earnings Correlation Summary
| Measurement | Scandinavian | Pima |
| Minimum | $2,499 | $6,642 |
| Maximum | $129,652 | $47,578 |
| Range | $127,153 | $40,936 |
| Mean | $43,051 | $34,771 |
| Median | $44,555 | $34,844 |
| Interquartile 25% (IQ1) | $34,442 | $30,058 |
| Interquartile 75% (IQ3) | $48,536 | $41,158 |
| Interquartile Range (IQR) | $14,094 | $11,100 |
| Standard Deviation (Sample) | $16,928 | $8,029 |
| Standard Deviation (Population) | $16,786 | $7,898 |
Similar Demographics by Median Earnings
Demographics Similar to Scandinavians by Median Earnings
In terms of median earnings, the demographic groups most similar to Scandinavians are Ghanaian ($46,440, a difference of 0.020%), Scottish ($46,463, a difference of 0.060%), Kenyan ($46,462, a difference of 0.060%), Basque ($46,399, a difference of 0.070%), and Danish ($46,392, a difference of 0.090%).
| Demographics | Rating | Rank | Median Earnings |
| Costa Ricans | 57.4 /100 | #167 | Average $46,645 |
| Immigrants | Africa | 54.6 /100 | #168 | Average $46,564 |
| Immigrants | South America | 54.0 /100 | #169 | Average $46,548 |
| Immigrants | Immigrants | 51.6 /100 | #170 | Average $46,478 |
| Scottish | 51.1 /100 | #171 | Average $46,463 |
| Kenyans | 51.0 /100 | #172 | Average $46,462 |
| Ghanaians | 50.3 /100 | #173 | Average $46,440 |
| Scandinavians | 50.0 /100 | #174 | Average $46,433 |
| Basques | 48.8 /100 | #175 | Average $46,399 |
| Danes | 48.6 /100 | #176 | Average $46,392 |
| Belgians | 48.0 /100 | #177 | Average $46,375 |
| Colombians | 47.1 /100 | #178 | Average $46,349 |
| English | 46.5 /100 | #179 | Average $46,334 |
| Puget Sound Salish | 46.5 /100 | #180 | Average $46,333 |
| Immigrants | Cameroon | 46.4 /100 | #181 | Average $46,329 |
Demographics Similar to Pima by Median Earnings
In terms of median earnings, the demographic groups most similar to Pima are Immigrants from Cuba ($38,426, a difference of 0.37%), Menominee ($37,884, a difference of 1.1%), Crow ($38,707, a difference of 1.1%), Native/Alaskan ($38,896, a difference of 1.6%), and Spanish American Indian ($38,907, a difference of 1.6%).
| Demographics | Rating | Rank | Median Earnings |
| Immigrants | Mexico | 0.0 /100 | #331 | Tragic $39,114 |
| Yakama | 0.0 /100 | #332 | Tragic $39,107 |
| Houma | 0.0 /100 | #333 | Tragic $38,949 |
| Spanish American Indians | 0.0 /100 | #334 | Tragic $38,907 |
| Natives/Alaskans | 0.0 /100 | #335 | Tragic $38,896 |
| Crow | 0.0 /100 | #336 | Tragic $38,707 |
| Immigrants | Cuba | 0.0 /100 | #337 | Tragic $38,426 |
| Pima | 0.0 /100 | #338 | Tragic $38,285 |
| Menominee | 0.0 /100 | #339 | Tragic $37,884 |
| Navajo | 0.0 /100 | #340 | Tragic $36,999 |
| Lumbee | 0.0 /100 | #341 | Tragic $36,876 |
| Hopi | 0.0 /100 | #342 | Tragic $36,871 |
| Pueblo | 0.0 /100 | #343 | Tragic $36,859 |
| Arapaho | 0.0 /100 | #344 | Tragic $36,586 |
| Tohono O'odham | 0.0 /100 | #345 | Tragic $36,349 |