Scandinavian vs Aleut Child Poverty Among Boys Under 16
COMPARE
Scandinavian
Aleut
Child Poverty Among Boys Under 16
Child Poverty Among Boys Under 16 Comparison
Scandinavians
Aleuts
14.4%
CHILD POVERTY AMONG BOYS UNDER 16
98.8/ 100
METRIC RATING
61st/ 347
METRIC RANK
17.7%
CHILD POVERTY AMONG BOYS UNDER 16
6.6/ 100
METRIC RATING
212th/ 347
METRIC RANK
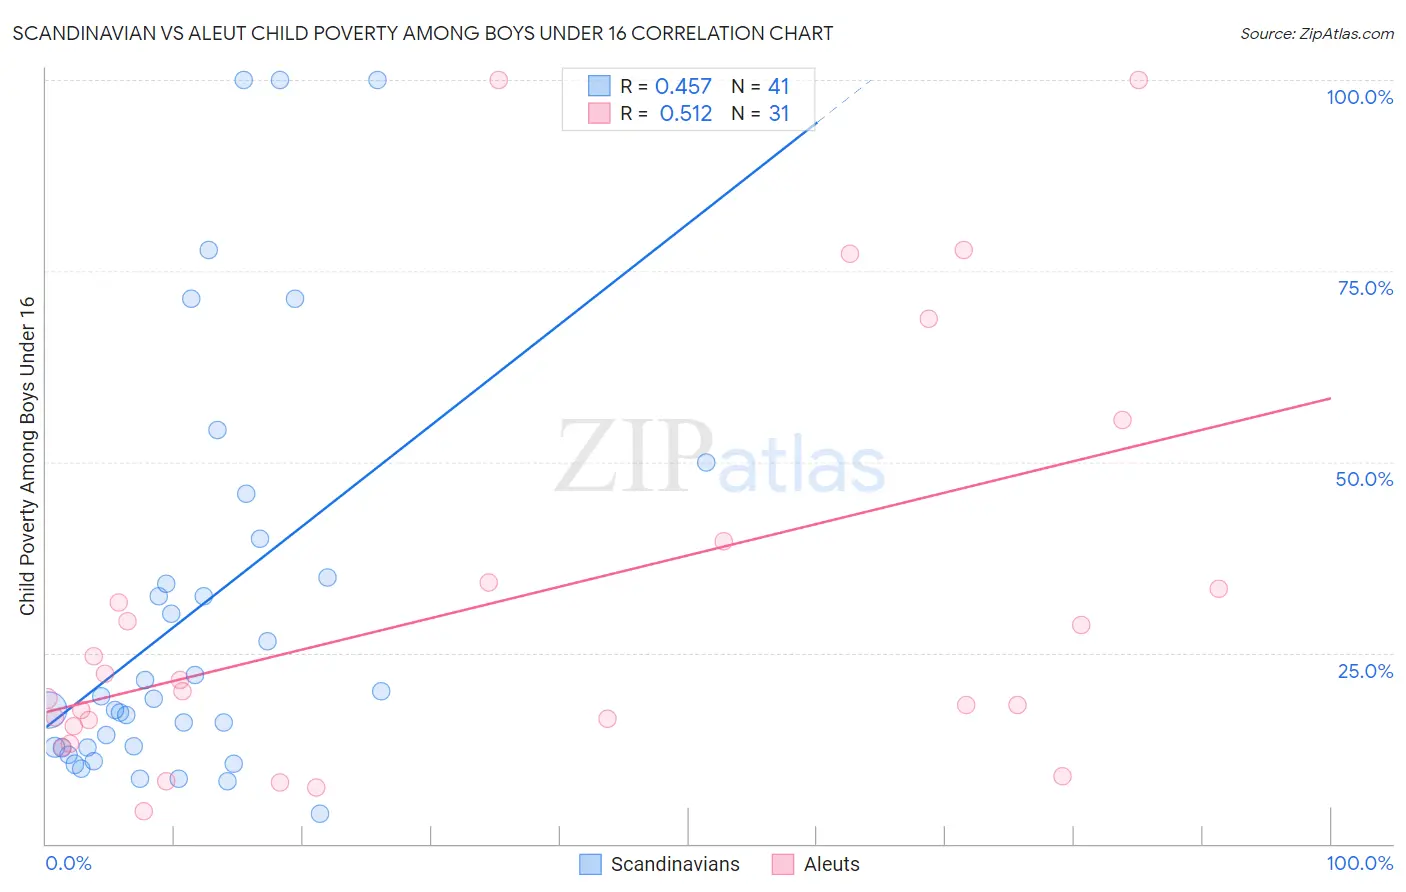
Scandinavian vs Aleut Child Poverty Among Boys Under 16 Correlation Chart
The statistical analysis conducted on geographies consisting of 460,968,733 people shows a moderate positive correlation between the proportion of Scandinavians and poverty level among boys under the age of 16 in the United States with a correlation coefficient (R) of 0.457 and weighted average of 14.4%. Similarly, the statistical analysis conducted on geographies consisting of 61,373,672 people shows a substantial positive correlation between the proportion of Aleuts and poverty level among boys under the age of 16 in the United States with a correlation coefficient (R) of 0.512 and weighted average of 17.7%, a difference of 22.6%.
Child Poverty Among Boys Under 16 Correlation Summary
| Measurement | Scandinavian | Aleut |
| Minimum | 4.0% | 4.2% |
| Maximum | 100.0% | 100.0% |
| Range | 96.0% | 95.8% |
| Mean | 30.5% | 31.1% |
| Median | 19.0% | 20.0% |
| Interquartile 25% (IQ1) | 12.6% | 15.3% |
| Interquartile 75% (IQ3) | 37.4% | 34.3% |
| Interquartile Range (IQR) | 24.8% | 19.0% |
| Standard Deviation (Sample) | 26.8% | 26.7% |
| Standard Deviation (Population) | 26.5% | 26.2% |
Similar Demographics by Child Poverty Among Boys Under 16
Demographics Similar to Scandinavians by Child Poverty Among Boys Under 16
In terms of child poverty among boys under 16, the demographic groups most similar to Scandinavians are Immigrants from Belgium (14.4%, a difference of 0.12%), Immigrants from Czechoslovakia (14.4%, a difference of 0.14%), Immigrants from Sweden (14.4%, a difference of 0.16%), Polish (14.4%, a difference of 0.24%), and Immigrants from Israel (14.4%, a difference of 0.32%).
| Demographics | Rating | Rank | Child Poverty Among Boys Under 16 |
| Immigrants | Serbia | 99.0 /100 | #54 | Exceptional 14.3% |
| Immigrants | Pakistan | 99.0 /100 | #55 | Exceptional 14.3% |
| Zimbabweans | 99.0 /100 | #56 | Exceptional 14.3% |
| Poles | 98.9 /100 | #57 | Exceptional 14.4% |
| Immigrants | Sweden | 98.9 /100 | #58 | Exceptional 14.4% |
| Immigrants | Czechoslovakia | 98.9 /100 | #59 | Exceptional 14.4% |
| Immigrants | Belgium | 98.9 /100 | #60 | Exceptional 14.4% |
| Scandinavians | 98.8 /100 | #61 | Exceptional 14.4% |
| Immigrants | Israel | 98.7 /100 | #62 | Exceptional 14.4% |
| Cambodians | 98.5 /100 | #63 | Exceptional 14.5% |
| Immigrants | Romania | 98.5 /100 | #64 | Exceptional 14.5% |
| Soviet Union | 98.5 /100 | #65 | Exceptional 14.5% |
| Immigrants | Bulgaria | 98.5 /100 | #66 | Exceptional 14.5% |
| Immigrants | Europe | 98.4 /100 | #67 | Exceptional 14.5% |
| Slovenes | 98.4 /100 | #68 | Exceptional 14.5% |
Demographics Similar to Aleuts by Child Poverty Among Boys Under 16
In terms of child poverty among boys under 16, the demographic groups most similar to Aleuts are Immigrants (17.6%, a difference of 0.050%), Immigrants from Armenia (17.6%, a difference of 0.11%), Immigrants from Eastern Africa (17.7%, a difference of 0.28%), Panamanian (17.7%, a difference of 0.28%), and Alaskan Athabascan (17.6%, a difference of 0.29%).
| Demographics | Rating | Rank | Child Poverty Among Boys Under 16 |
| Immigrants | Portugal | 11.2 /100 | #205 | Poor 17.4% |
| German Russians | 10.9 /100 | #206 | Poor 17.4% |
| Immigrants | Thailand | 8.2 /100 | #207 | Tragic 17.5% |
| Malaysians | 7.6 /100 | #208 | Tragic 17.6% |
| Alaskan Athabascans | 7.3 /100 | #209 | Tragic 17.6% |
| Immigrants | Armenia | 6.8 /100 | #210 | Tragic 17.6% |
| Immigrants | Immigrants | 6.7 /100 | #211 | Tragic 17.6% |
| Aleuts | 6.6 /100 | #212 | Tragic 17.7% |
| Immigrants | Eastern Africa | 6.0 /100 | #213 | Tragic 17.7% |
| Panamanians | 5.9 /100 | #214 | Tragic 17.7% |
| Osage | 5.8 /100 | #215 | Tragic 17.7% |
| Moroccans | 5.6 /100 | #216 | Tragic 17.7% |
| Japanese | 5.5 /100 | #217 | Tragic 17.7% |
| Iraqis | 5.5 /100 | #218 | Tragic 17.7% |
| Sierra Leoneans | 5.3 /100 | #219 | Tragic 17.8% |