Welsh vs Aleut Median Male Earnings
COMPARE
Welsh
Aleut
Median Male Earnings
Median Male Earnings Comparison
Welsh
Aleuts
$54,647
MEDIAN MALE EARNINGS
53.8/ 100
METRIC RATING
172nd/ 347
METRIC RANK
$51,168
MEDIAN MALE EARNINGS
3.7/ 100
METRIC RATING
233rd/ 347
METRIC RANK
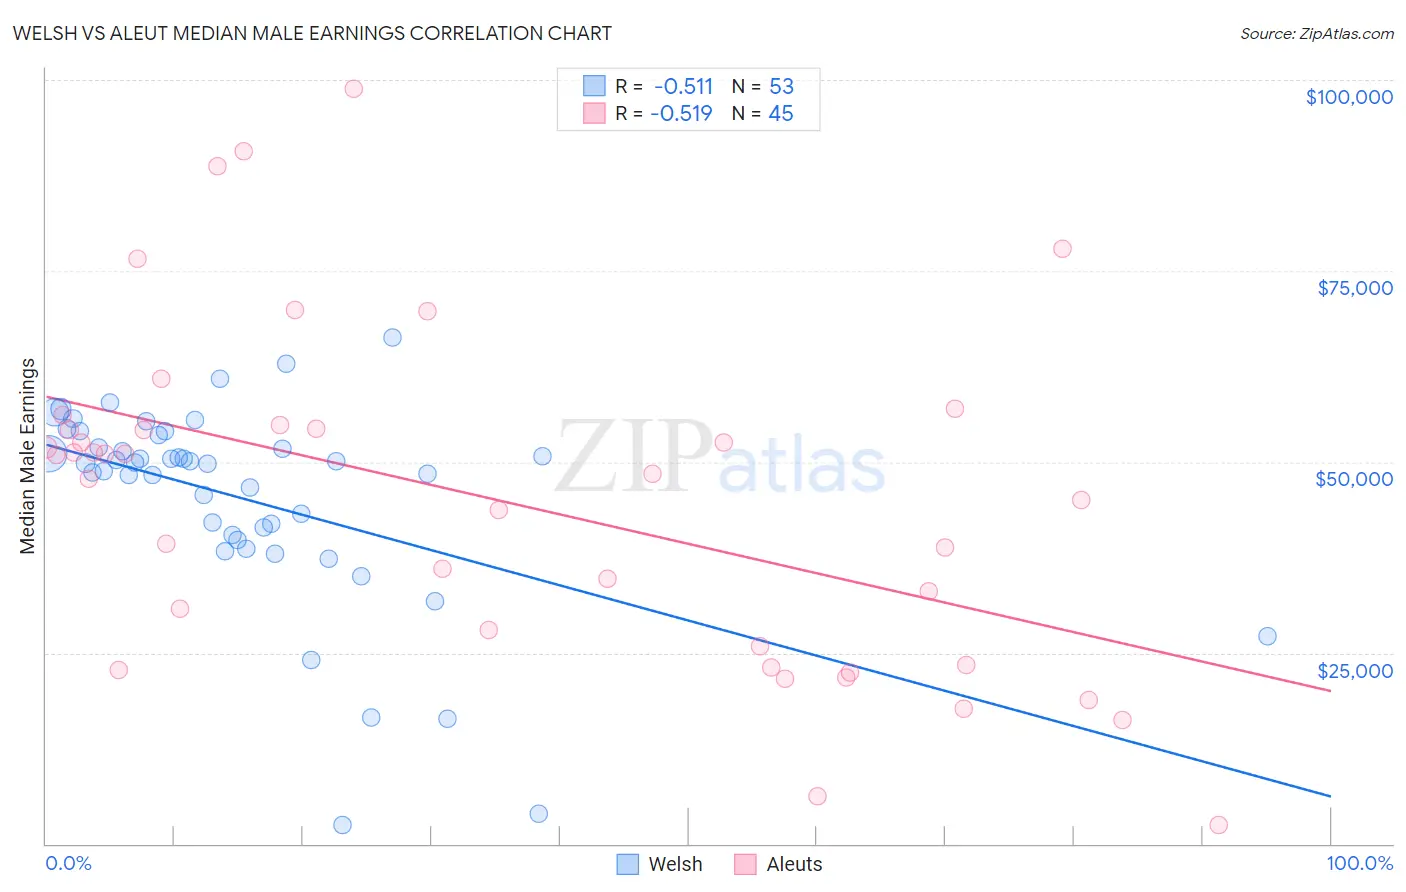
Welsh vs Aleut Median Male Earnings Correlation Chart
The statistical analysis conducted on geographies consisting of 527,949,095 people shows a substantial negative correlation between the proportion of Welsh and median male earnings in the United States with a correlation coefficient (R) of -0.511 and weighted average of $54,647. Similarly, the statistical analysis conducted on geographies consisting of 61,765,699 people shows a substantial negative correlation between the proportion of Aleuts and median male earnings in the United States with a correlation coefficient (R) of -0.519 and weighted average of $51,168, a difference of 6.8%.
Median Male Earnings Correlation Summary
| Measurement | Welsh | Aleut |
| Minimum | $2,499 | $2,499 |
| Maximum | $66,364 | $98,906 |
| Range | $63,865 | $96,407 |
| Mean | $45,194 | $44,984 |
| Median | $49,839 | $48,500 |
| Interquartile 25% (IQ1) | $40,118 | $24,583 |
| Interquartile 75% (IQ3) | $52,741 | $54,582 |
| Interquartile Range (IQR) | $12,623 | $29,999 |
| Standard Deviation (Sample) | $13,217 | $22,008 |
| Standard Deviation (Population) | $13,092 | $21,762 |
Similar Demographics by Median Male Earnings
Demographics Similar to Welsh by Median Male Earnings
In terms of median male earnings, the demographic groups most similar to Welsh are Immigrants from Peru ($54,695, a difference of 0.090%), French Canadian ($54,722, a difference of 0.14%), Finnish ($54,721, a difference of 0.14%), South American Indian ($54,508, a difference of 0.25%), and South American ($54,492, a difference of 0.28%).
| Demographics | Rating | Rank | Median Male Earnings |
| Immigrants | Portugal | 66.3 /100 | #165 | Good $55,182 |
| Germans | 61.6 /100 | #166 | Good $54,974 |
| Immigrants | Fiji | 61.2 /100 | #167 | Good $54,958 |
| Immigrants | Vietnam | 60.2 /100 | #168 | Good $54,913 |
| French Canadians | 55.6 /100 | #169 | Average $54,722 |
| Finns | 55.6 /100 | #170 | Average $54,721 |
| Immigrants | Peru | 54.9 /100 | #171 | Average $54,695 |
| Welsh | 53.8 /100 | #172 | Average $54,647 |
| South American Indians | 50.4 /100 | #173 | Average $54,508 |
| South Americans | 50.0 /100 | #174 | Average $54,492 |
| Dutch | 48.0 /100 | #175 | Average $54,410 |
| Spaniards | 47.8 /100 | #176 | Average $54,401 |
| Costa Ricans | 44.8 /100 | #177 | Average $54,279 |
| Sierra Leoneans | 44.8 /100 | #178 | Average $54,279 |
| Celtics | 43.9 /100 | #179 | Average $54,242 |
Demographics Similar to Aleuts by Median Male Earnings
In terms of median male earnings, the demographic groups most similar to Aleuts are Sudanese ($51,216, a difference of 0.090%), Barbadian ($51,236, a difference of 0.13%), Cape Verdean ($51,103, a difference of 0.13%), Immigrants from Nigeria ($51,310, a difference of 0.28%), and Immigrants from Trinidad and Tobago ($51,376, a difference of 0.41%).
| Demographics | Rating | Rank | Median Male Earnings |
| Japanese | 4.9 /100 | #226 | Tragic $51,473 |
| Trinidadians and Tobagonians | 4.8 /100 | #227 | Tragic $51,446 |
| Samoans | 4.6 /100 | #228 | Tragic $51,389 |
| Immigrants | Trinidad and Tobago | 4.5 /100 | #229 | Tragic $51,376 |
| Immigrants | Nigeria | 4.2 /100 | #230 | Tragic $51,310 |
| Barbadians | 3.9 /100 | #231 | Tragic $51,236 |
| Sudanese | 3.9 /100 | #232 | Tragic $51,216 |
| Aleuts | 3.7 /100 | #233 | Tragic $51,168 |
| Cape Verdeans | 3.5 /100 | #234 | Tragic $51,103 |
| Immigrants | Western Africa | 3.0 /100 | #235 | Tragic $50,940 |
| Pennsylvania Germans | 2.8 /100 | #236 | Tragic $50,878 |
| Immigrants | Barbados | 2.6 /100 | #237 | Tragic $50,795 |
| Malaysians | 2.5 /100 | #238 | Tragic $50,772 |
| Americans | 2.5 /100 | #239 | Tragic $50,761 |
| West Indians | 2.3 /100 | #240 | Tragic $50,682 |