Samoan vs Immigrants from Trinidad and Tobago Householder Income Ages 45 - 64 years
COMPARE
Samoan
Immigrants from Trinidad and Tobago
Householder Income Ages 45 - 64 years
Householder Income Ages 45 - 64 years Comparison
Samoans
Immigrants from Trinidad and Tobago
$101,580
HOUSEHOLDER INCOME AGES 45 - 64 YEARS
65.3/ 100
METRIC RATING
166th/ 347
METRIC RANK
$91,347
HOUSEHOLDER INCOME AGES 45 - 64 YEARS
1.1/ 100
METRIC RATING
243rd/ 347
METRIC RANK
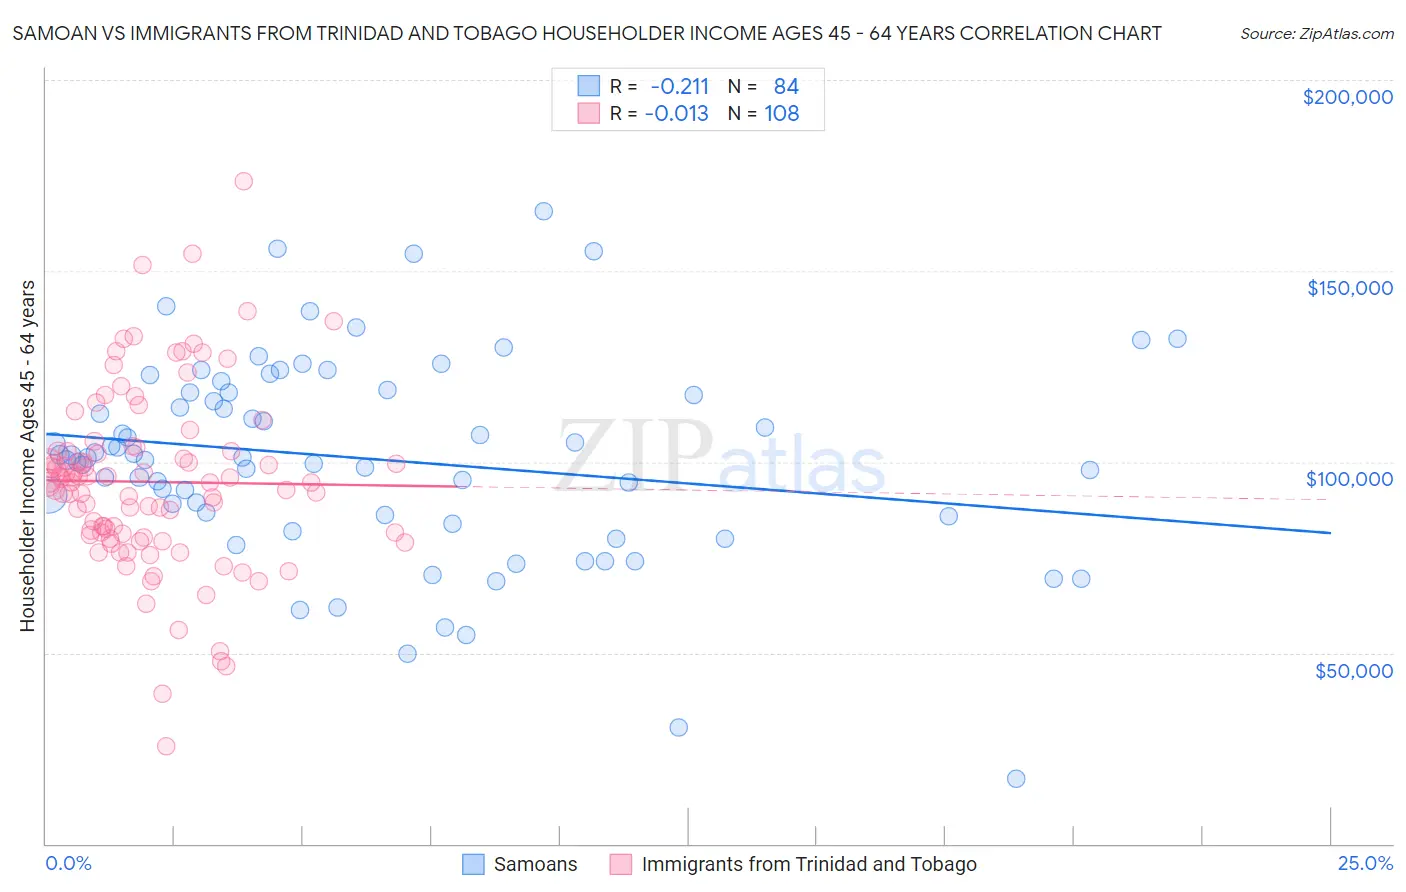
Samoan vs Immigrants from Trinidad and Tobago Householder Income Ages 45 - 64 years Correlation Chart
The statistical analysis conducted on geographies consisting of 224,959,731 people shows a weak negative correlation between the proportion of Samoans and household income with householder between the ages 45 and 64 in the United States with a correlation coefficient (R) of -0.211 and weighted average of $101,580. Similarly, the statistical analysis conducted on geographies consisting of 223,374,327 people shows no correlation between the proportion of Immigrants from Trinidad and Tobago and household income with householder between the ages 45 and 64 in the United States with a correlation coefficient (R) of -0.013 and weighted average of $91,347, a difference of 11.2%.
Householder Income Ages 45 - 64 years Correlation Summary
| Measurement | Samoan | Immigrants from Trinidad and Tobago |
| Minimum | $16,995 | $25,417 |
| Maximum | $165,714 | $173,438 |
| Range | $148,719 | $148,021 |
| Mean | $100,718 | $94,766 |
| Median | $101,006 | $94,630 |
| Interquartile 25% (IQ1) | $85,977 | $80,933 |
| Interquartile 75% (IQ3) | $118,111 | $102,864 |
| Interquartile Range (IQR) | $32,135 | $21,931 |
| Standard Deviation (Sample) | $26,759 | $23,554 |
| Standard Deviation (Population) | $26,599 | $23,445 |
Similar Demographics by Householder Income Ages 45 - 64 years
Demographics Similar to Samoans by Householder Income Ages 45 - 64 years
In terms of householder income ages 45 - 64 years, the demographic groups most similar to Samoans are Czechoslovakian ($101,387, a difference of 0.19%), Immigrants from Albania ($101,957, a difference of 0.37%), South American Indian ($101,171, a difference of 0.40%), Guamanian/Chamorro ($101,170, a difference of 0.41%), and English ($102,021, a difference of 0.43%).
| Demographics | Rating | Rank | Householder Income Ages 45 - 64 years |
| Sierra Leoneans | 74.2 /100 | #159 | Good $102,427 |
| Icelanders | 72.5 /100 | #160 | Good $102,261 |
| Immigrants | Nepal | 71.8 /100 | #161 | Good $102,190 |
| Scottish | 71.1 /100 | #162 | Good $102,123 |
| English | 70.1 /100 | #163 | Good $102,021 |
| Immigrants | Morocco | 70.0 /100 | #164 | Good $102,015 |
| Immigrants | Albania | 69.4 /100 | #165 | Good $101,957 |
| Samoans | 65.3 /100 | #166 | Good $101,580 |
| Czechoslovakians | 63.0 /100 | #167 | Good $101,387 |
| South American Indians | 60.5 /100 | #168 | Good $101,171 |
| Guamanians/Chamorros | 60.5 /100 | #169 | Good $101,170 |
| Slovaks | 58.8 /100 | #170 | Average $101,029 |
| South Americans | 56.4 /100 | #171 | Average $100,837 |
| Immigrants | Uzbekistan | 52.5 /100 | #172 | Average $100,523 |
| Alsatians | 51.4 /100 | #173 | Average $100,435 |
Demographics Similar to Immigrants from Trinidad and Tobago by Householder Income Ages 45 - 64 years
In terms of householder income ages 45 - 64 years, the demographic groups most similar to Immigrants from Trinidad and Tobago are Trinidadian and Tobagonian ($91,357, a difference of 0.010%), Inupiat ($91,355, a difference of 0.010%), Immigrants from Burma/Myanmar ($91,385, a difference of 0.040%), Immigrants from Middle Africa ($91,293, a difference of 0.060%), and Immigrants from Ecuador ($91,462, a difference of 0.13%).
| Demographics | Rating | Rank | Householder Income Ages 45 - 64 years |
| Immigrants | Western Africa | 1.8 /100 | #236 | Tragic $92,384 |
| Immigrants | Bangladesh | 1.7 /100 | #237 | Tragic $92,208 |
| Pennsylvania Germans | 1.5 /100 | #238 | Tragic $91,956 |
| Immigrants | Ecuador | 1.2 /100 | #239 | Tragic $91,462 |
| Immigrants | Burma/Myanmar | 1.1 /100 | #240 | Tragic $91,385 |
| Trinidadians and Tobagonians | 1.1 /100 | #241 | Tragic $91,357 |
| Inupiat | 1.1 /100 | #242 | Tragic $91,355 |
| Immigrants | Trinidad and Tobago | 1.1 /100 | #243 | Tragic $91,347 |
| Immigrants | Middle Africa | 1.1 /100 | #244 | Tragic $91,293 |
| Guyanese | 0.9 /100 | #245 | Tragic $90,966 |
| Central Americans | 0.9 /100 | #246 | Tragic $90,951 |
| Alaskan Athabascans | 0.9 /100 | #247 | Tragic $90,951 |
| Immigrants | Laos | 0.9 /100 | #248 | Tragic $90,909 |
| Mexican American Indians | 0.8 /100 | #249 | Tragic $90,811 |
| Sub-Saharan Africans | 0.8 /100 | #250 | Tragic $90,691 |