Samoan vs Afghan Householder Income Ages 45 - 64 years
COMPARE
Samoan
Afghan
Householder Income Ages 45 - 64 years
Householder Income Ages 45 - 64 years Comparison
Samoans
Afghans
$101,580
HOUSEHOLDER INCOME AGES 45 - 64 YEARS
65.3/ 100
METRIC RATING
166th/ 347
METRIC RANK
$112,676
HOUSEHOLDER INCOME AGES 45 - 64 YEARS
99.8/ 100
METRIC RATING
53rd/ 347
METRIC RANK
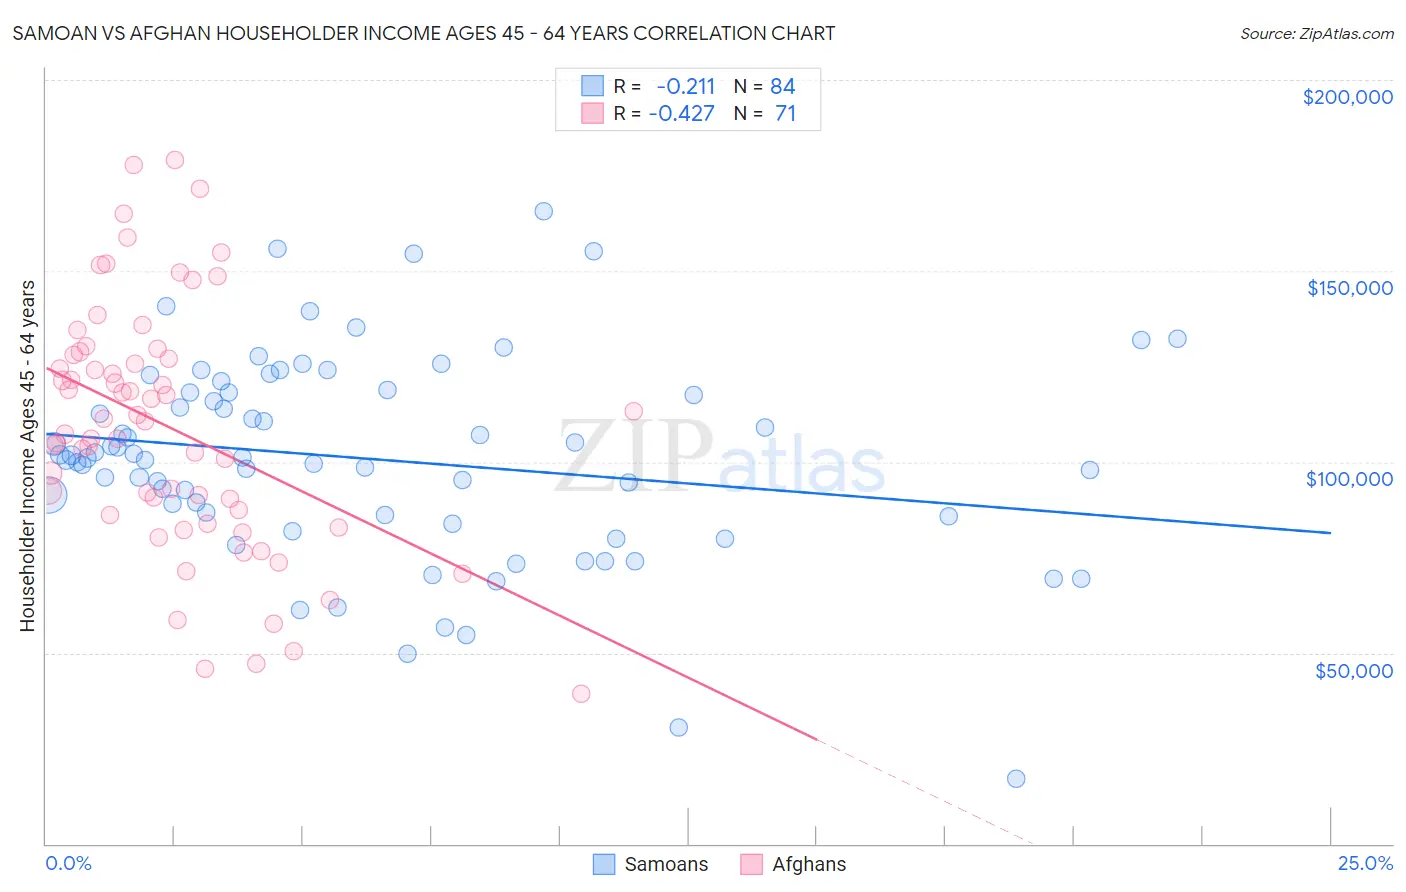
Samoan vs Afghan Householder Income Ages 45 - 64 years Correlation Chart
The statistical analysis conducted on geographies consisting of 224,959,731 people shows a weak negative correlation between the proportion of Samoans and household income with householder between the ages 45 and 64 in the United States with a correlation coefficient (R) of -0.211 and weighted average of $101,580. Similarly, the statistical analysis conducted on geographies consisting of 148,795,333 people shows a moderate negative correlation between the proportion of Afghans and household income with householder between the ages 45 and 64 in the United States with a correlation coefficient (R) of -0.427 and weighted average of $112,676, a difference of 10.9%.
Householder Income Ages 45 - 64 years Correlation Summary
| Measurement | Samoan | Afghan |
| Minimum | $16,995 | $39,280 |
| Maximum | $165,714 | $179,167 |
| Range | $148,719 | $139,887 |
| Mean | $100,718 | $108,848 |
| Median | $101,006 | $110,488 |
| Interquartile 25% (IQ1) | $85,977 | $85,959 |
| Interquartile 75% (IQ3) | $118,111 | $128,039 |
| Interquartile Range (IQR) | $32,135 | $42,080 |
| Standard Deviation (Sample) | $26,759 | $32,099 |
| Standard Deviation (Population) | $26,599 | $31,872 |
Similar Demographics by Householder Income Ages 45 - 64 years
Demographics Similar to Samoans by Householder Income Ages 45 - 64 years
In terms of householder income ages 45 - 64 years, the demographic groups most similar to Samoans are Czechoslovakian ($101,387, a difference of 0.19%), Immigrants from Albania ($101,957, a difference of 0.37%), South American Indian ($101,171, a difference of 0.40%), Guamanian/Chamorro ($101,170, a difference of 0.41%), and English ($102,021, a difference of 0.43%).
| Demographics | Rating | Rank | Householder Income Ages 45 - 64 years |
| Sierra Leoneans | 74.2 /100 | #159 | Good $102,427 |
| Icelanders | 72.5 /100 | #160 | Good $102,261 |
| Immigrants | Nepal | 71.8 /100 | #161 | Good $102,190 |
| Scottish | 71.1 /100 | #162 | Good $102,123 |
| English | 70.1 /100 | #163 | Good $102,021 |
| Immigrants | Morocco | 70.0 /100 | #164 | Good $102,015 |
| Immigrants | Albania | 69.4 /100 | #165 | Good $101,957 |
| Samoans | 65.3 /100 | #166 | Good $101,580 |
| Czechoslovakians | 63.0 /100 | #167 | Good $101,387 |
| South American Indians | 60.5 /100 | #168 | Good $101,171 |
| Guamanians/Chamorros | 60.5 /100 | #169 | Good $101,170 |
| Slovaks | 58.8 /100 | #170 | Average $101,029 |
| South Americans | 56.4 /100 | #171 | Average $100,837 |
| Immigrants | Uzbekistan | 52.5 /100 | #172 | Average $100,523 |
| Alsatians | 51.4 /100 | #173 | Average $100,435 |
Demographics Similar to Afghans by Householder Income Ages 45 - 64 years
In terms of householder income ages 45 - 64 years, the demographic groups most similar to Afghans are Greek ($112,630, a difference of 0.040%), Immigrants from Malaysia ($112,796, a difference of 0.11%), Lithuanian ($112,484, a difference of 0.17%), Immigrants from South Africa ($112,886, a difference of 0.19%), and Egyptian ($112,256, a difference of 0.37%).
| Demographics | Rating | Rank | Householder Income Ages 45 - 64 years |
| Immigrants | Greece | 99.9 /100 | #46 | Exceptional $113,548 |
| Australians | 99.9 /100 | #47 | Exceptional $113,533 |
| Immigrants | Indonesia | 99.9 /100 | #48 | Exceptional $113,519 |
| Immigrants | Russia | 99.8 /100 | #49 | Exceptional $113,215 |
| Immigrants | Austria | 99.8 /100 | #50 | Exceptional $113,140 |
| Immigrants | South Africa | 99.8 /100 | #51 | Exceptional $112,886 |
| Immigrants | Malaysia | 99.8 /100 | #52 | Exceptional $112,796 |
| Afghans | 99.8 /100 | #53 | Exceptional $112,676 |
| Greeks | 99.8 /100 | #54 | Exceptional $112,630 |
| Lithuanians | 99.8 /100 | #55 | Exceptional $112,484 |
| Egyptians | 99.7 /100 | #56 | Exceptional $112,256 |
| Immigrants | Scotland | 99.7 /100 | #57 | Exceptional $112,175 |
| Soviet Union | 99.7 /100 | #58 | Exceptional $112,008 |
| Immigrants | Europe | 99.7 /100 | #59 | Exceptional $111,984 |
| Immigrants | Netherlands | 99.7 /100 | #60 | Exceptional $111,982 |