Samoan vs Immigrants from Trinidad and Tobago 6th Grade
COMPARE
Samoan
Immigrants from Trinidad and Tobago
6th Grade
6th Grade Comparison
Samoans
Immigrants from Trinidad and Tobago
96.8%
6TH GRADE
11.0/ 100
METRIC RATING
208th/ 347
METRIC RANK
96.2%
6TH GRADE
0.0/ 100
METRIC RATING
287th/ 347
METRIC RANK
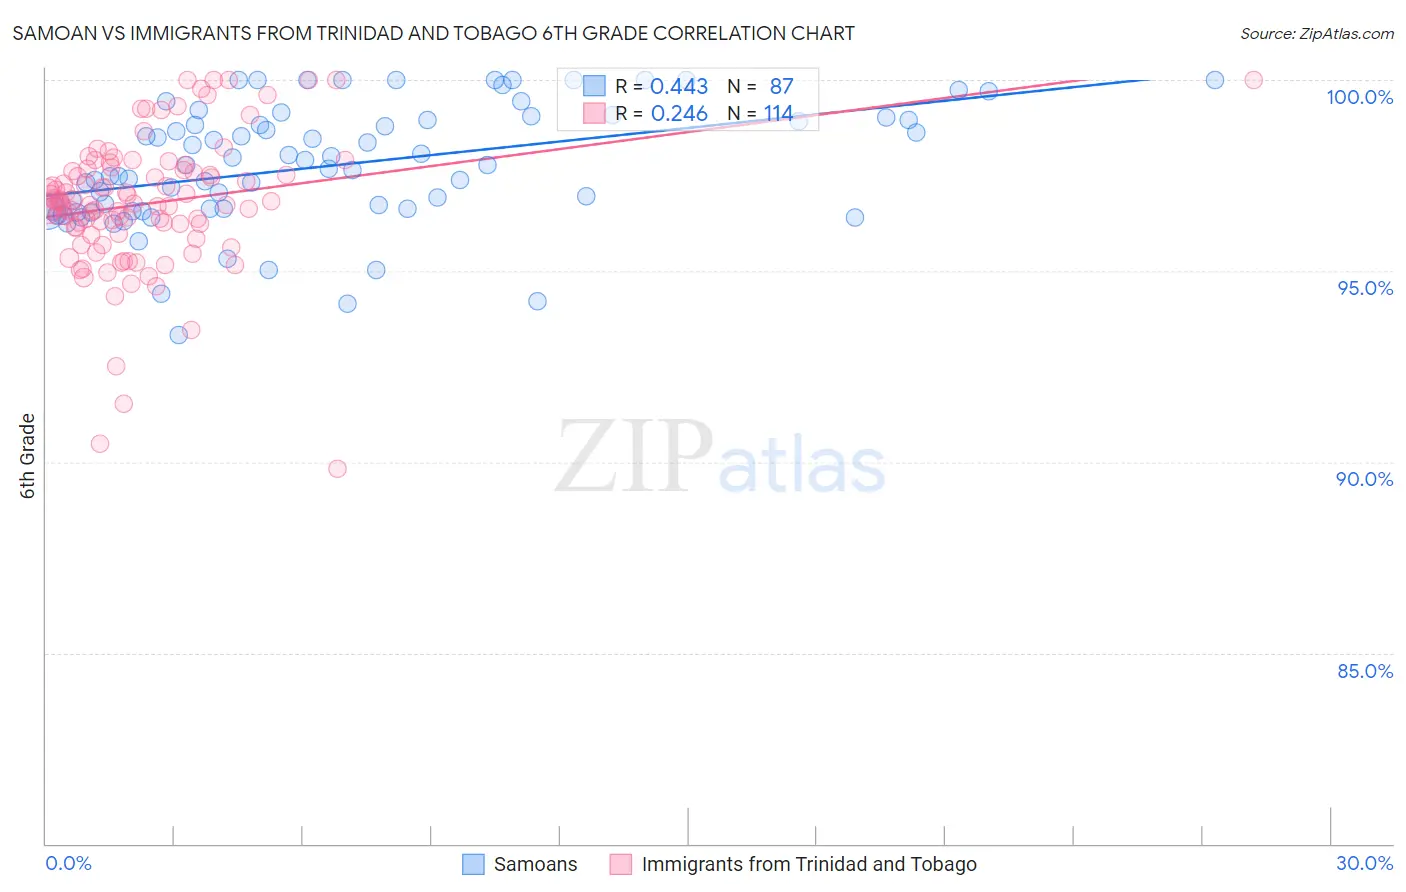
Samoan vs Immigrants from Trinidad and Tobago 6th Grade Correlation Chart
The statistical analysis conducted on geographies consisting of 225,201,909 people shows a moderate positive correlation between the proportion of Samoans and percentage of population with at least 6th grade education in the United States with a correlation coefficient (R) of 0.443 and weighted average of 96.8%. Similarly, the statistical analysis conducted on geographies consisting of 223,526,834 people shows a weak positive correlation between the proportion of Immigrants from Trinidad and Tobago and percentage of population with at least 6th grade education in the United States with a correlation coefficient (R) of 0.246 and weighted average of 96.2%, a difference of 0.67%.
6th Grade Correlation Summary
| Measurement | Samoan | Immigrants from Trinidad and Tobago |
| Minimum | 93.3% | 89.8% |
| Maximum | 100.0% | 100.0% |
| Range | 6.7% | 10.2% |
| Mean | 97.8% | 96.8% |
| Median | 97.8% | 96.7% |
| Interquartile 25% (IQ1) | 96.6% | 96.1% |
| Interquartile 75% (IQ3) | 99.0% | 97.6% |
| Interquartile Range (IQR) | 2.4% | 1.5% |
| Standard Deviation (Sample) | 1.6% | 1.8% |
| Standard Deviation (Population) | 1.6% | 1.8% |
Similar Demographics by 6th Grade
Demographics Similar to Samoans by 6th Grade
In terms of 6th grade, the demographic groups most similar to Samoans are Immigrants from Oceania (96.8%, a difference of 0.0%), Laotian (96.8%, a difference of 0.010%), Iraqi (96.8%, a difference of 0.010%), Immigrants from Nepal (96.8%, a difference of 0.010%), and Native/Alaskan (96.8%, a difference of 0.020%).
| Demographics | Rating | Rank | 6th Grade |
| Immigrants | Zaire | 14.5 /100 | #201 | Poor 96.9% |
| Immigrants | Chile | 14.2 /100 | #202 | Poor 96.8% |
| Sudanese | 13.9 /100 | #203 | Poor 96.8% |
| Immigrants | Bahamas | 13.8 /100 | #204 | Poor 96.8% |
| Natives/Alaskans | 13.0 /100 | #205 | Poor 96.8% |
| Laotians | 11.8 /100 | #206 | Poor 96.8% |
| Iraqis | 11.7 /100 | #207 | Poor 96.8% |
| Samoans | 11.0 /100 | #208 | Poor 96.8% |
| Immigrants | Oceania | 11.0 /100 | #209 | Poor 96.8% |
| Immigrants | Nepal | 10.1 /100 | #210 | Poor 96.8% |
| Immigrants | Iraq | 9.2 /100 | #211 | Tragic 96.8% |
| Moroccans | 9.0 /100 | #212 | Tragic 96.8% |
| Immigrants | Sudan | 8.7 /100 | #213 | Tragic 96.8% |
| Portuguese | 8.2 /100 | #214 | Tragic 96.8% |
| Sierra Leoneans | 8.0 /100 | #215 | Tragic 96.8% |
Demographics Similar to Immigrants from Trinidad and Tobago by 6th Grade
In terms of 6th grade, the demographic groups most similar to Immigrants from Trinidad and Tobago are Barbadian (96.2%, a difference of 0.010%), Malaysian (96.2%, a difference of 0.010%), Immigrants from Eritrea (96.1%, a difference of 0.030%), Somali (96.2%, a difference of 0.040%), and Fijian (96.2%, a difference of 0.050%).
| Demographics | Rating | Rank | 6th Grade |
| Immigrants | Afghanistan | 0.1 /100 | #280 | Tragic 96.2% |
| Trinidadians and Tobagonians | 0.1 /100 | #281 | Tragic 96.2% |
| Houma | 0.1 /100 | #282 | Tragic 96.2% |
| Cubans | 0.1 /100 | #283 | Tragic 96.2% |
| Fijians | 0.1 /100 | #284 | Tragic 96.2% |
| Somalis | 0.1 /100 | #285 | Tragic 96.2% |
| Barbadians | 0.0 /100 | #286 | Tragic 96.2% |
| Immigrants | Trinidad and Tobago | 0.0 /100 | #287 | Tragic 96.2% |
| Malaysians | 0.0 /100 | #288 | Tragic 96.2% |
| Immigrants | Eritrea | 0.0 /100 | #289 | Tragic 96.1% |
| Immigrants | Somalia | 0.0 /100 | #290 | Tragic 96.1% |
| Immigrants | St. Vincent and the Grenadines | 0.0 /100 | #291 | Tragic 96.1% |
| Immigrants | Barbados | 0.0 /100 | #292 | Tragic 96.1% |
| Immigrants | West Indies | 0.0 /100 | #293 | Tragic 96.1% |
| British West Indians | 0.0 /100 | #294 | Tragic 96.0% |