Samoan vs Immigrants from Honduras Householder Income Ages 45 - 64 years
COMPARE
Samoan
Immigrants from Honduras
Householder Income Ages 45 - 64 years
Householder Income Ages 45 - 64 years Comparison
Samoans
Immigrants from Honduras
$101,580
HOUSEHOLDER INCOME AGES 45 - 64 YEARS
65.3/ 100
METRIC RATING
166th/ 347
METRIC RANK
$82,697
HOUSEHOLDER INCOME AGES 45 - 64 YEARS
0.0/ 100
METRIC RATING
314th/ 347
METRIC RANK
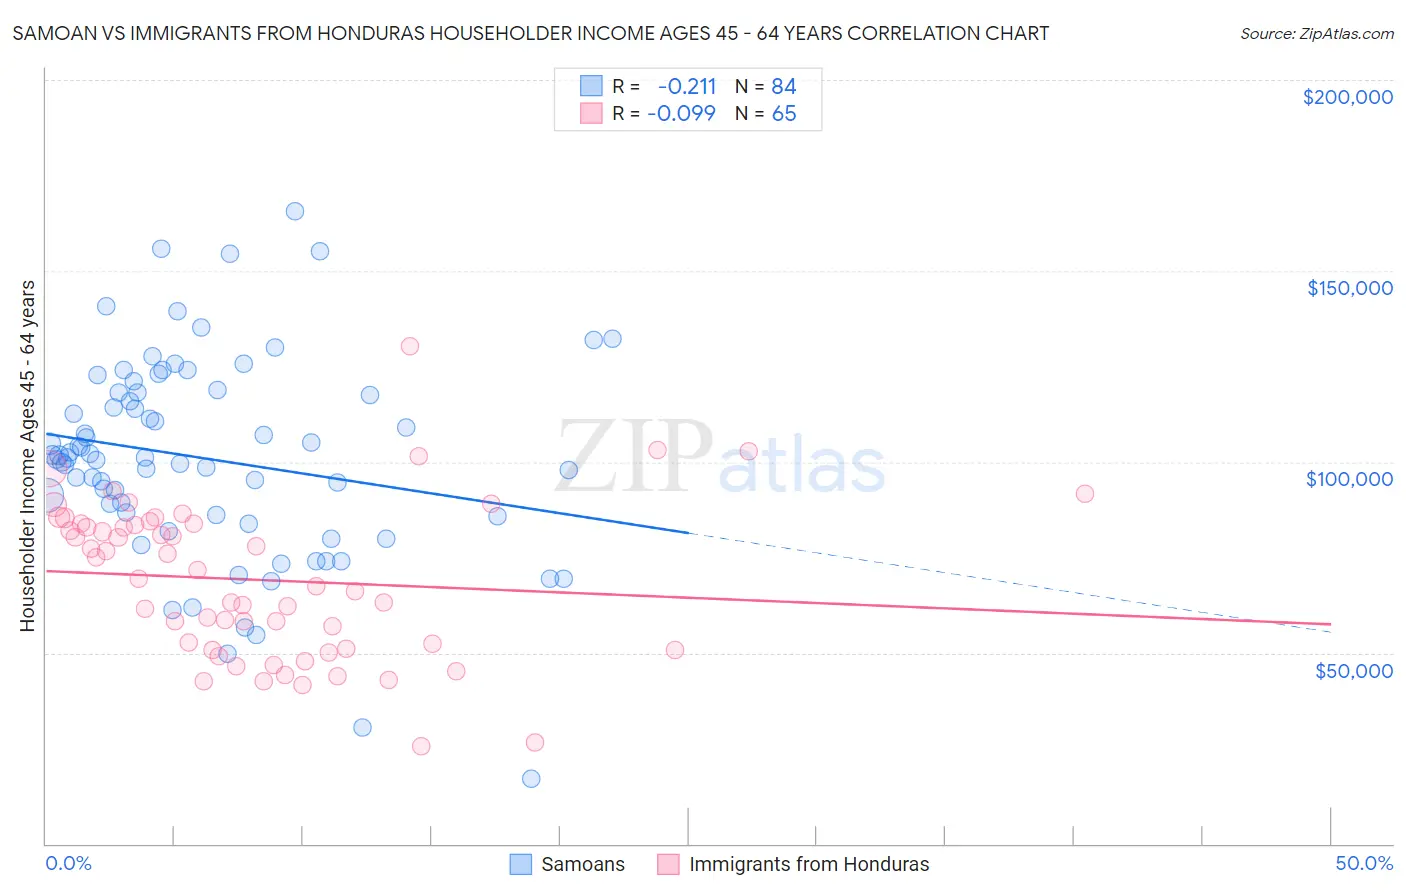
Samoan vs Immigrants from Honduras Householder Income Ages 45 - 64 years Correlation Chart
The statistical analysis conducted on geographies consisting of 224,959,731 people shows a weak negative correlation between the proportion of Samoans and household income with householder between the ages 45 and 64 in the United States with a correlation coefficient (R) of -0.211 and weighted average of $101,580. Similarly, the statistical analysis conducted on geographies consisting of 322,186,782 people shows a slight negative correlation between the proportion of Immigrants from Honduras and household income with householder between the ages 45 and 64 in the United States with a correlation coefficient (R) of -0.099 and weighted average of $82,697, a difference of 22.8%.
Householder Income Ages 45 - 64 years Correlation Summary
| Measurement | Samoan | Immigrants from Honduras |
| Minimum | $16,995 | $25,625 |
| Maximum | $165,714 | $130,200 |
| Range | $148,719 | $104,575 |
| Mean | $100,718 | $69,055 |
| Median | $101,006 | $69,386 |
| Interquartile 25% (IQ1) | $85,977 | $50,934 |
| Interquartile 75% (IQ3) | $118,111 | $83,889 |
| Interquartile Range (IQR) | $32,135 | $32,956 |
| Standard Deviation (Sample) | $26,759 | $20,449 |
| Standard Deviation (Population) | $26,599 | $20,291 |
Similar Demographics by Householder Income Ages 45 - 64 years
Demographics Similar to Samoans by Householder Income Ages 45 - 64 years
In terms of householder income ages 45 - 64 years, the demographic groups most similar to Samoans are Czechoslovakian ($101,387, a difference of 0.19%), Immigrants from Albania ($101,957, a difference of 0.37%), South American Indian ($101,171, a difference of 0.40%), Guamanian/Chamorro ($101,170, a difference of 0.41%), and English ($102,021, a difference of 0.43%).
| Demographics | Rating | Rank | Householder Income Ages 45 - 64 years |
| Sierra Leoneans | 74.2 /100 | #159 | Good $102,427 |
| Icelanders | 72.5 /100 | #160 | Good $102,261 |
| Immigrants | Nepal | 71.8 /100 | #161 | Good $102,190 |
| Scottish | 71.1 /100 | #162 | Good $102,123 |
| English | 70.1 /100 | #163 | Good $102,021 |
| Immigrants | Morocco | 70.0 /100 | #164 | Good $102,015 |
| Immigrants | Albania | 69.4 /100 | #165 | Good $101,957 |
| Samoans | 65.3 /100 | #166 | Good $101,580 |
| Czechoslovakians | 63.0 /100 | #167 | Good $101,387 |
| South American Indians | 60.5 /100 | #168 | Good $101,171 |
| Guamanians/Chamorros | 60.5 /100 | #169 | Good $101,170 |
| Slovaks | 58.8 /100 | #170 | Average $101,029 |
| South Americans | 56.4 /100 | #171 | Average $100,837 |
| Immigrants | Uzbekistan | 52.5 /100 | #172 | Average $100,523 |
| Alsatians | 51.4 /100 | #173 | Average $100,435 |
Demographics Similar to Immigrants from Honduras by Householder Income Ages 45 - 64 years
In terms of householder income ages 45 - 64 years, the demographic groups most similar to Immigrants from Honduras are U.S. Virgin Islander ($82,736, a difference of 0.050%), Paiute ($82,629, a difference of 0.080%), Immigrants from Caribbean ($82,513, a difference of 0.22%), Colville ($82,474, a difference of 0.27%), and Cajun ($83,015, a difference of 0.39%).
| Demographics | Rating | Rank | Householder Income Ages 45 - 64 years |
| Shoshone | 0.0 /100 | #307 | Tragic $83,588 |
| Immigrants | Cabo Verde | 0.0 /100 | #308 | Tragic $83,542 |
| Immigrants | Dominica | 0.0 /100 | #309 | Tragic $83,311 |
| Immigrants | Haiti | 0.0 /100 | #310 | Tragic $83,257 |
| Immigrants | Bahamas | 0.0 /100 | #311 | Tragic $83,177 |
| Cajuns | 0.0 /100 | #312 | Tragic $83,015 |
| U.S. Virgin Islanders | 0.0 /100 | #313 | Tragic $82,736 |
| Immigrants | Honduras | 0.0 /100 | #314 | Tragic $82,697 |
| Paiute | 0.0 /100 | #315 | Tragic $82,629 |
| Immigrants | Caribbean | 0.0 /100 | #316 | Tragic $82,513 |
| Colville | 0.0 /100 | #317 | Tragic $82,474 |
| Choctaw | 0.0 /100 | #318 | Tragic $82,287 |
| Chickasaw | 0.0 /100 | #319 | Tragic $82,193 |
| Apache | 0.0 /100 | #320 | Tragic $82,184 |
| Yuman | 0.0 /100 | #321 | Tragic $82,139 |