Belizean vs Immigrants from Trinidad and Tobago Householder Income Ages 45 - 64 years
COMPARE
Belizean
Immigrants from Trinidad and Tobago
Householder Income Ages 45 - 64 years
Householder Income Ages 45 - 64 years Comparison
Belizeans
Immigrants from Trinidad and Tobago
$88,684
HOUSEHOLDER INCOME AGES 45 - 64 YEARS
0.3/ 100
METRIC RATING
261st/ 347
METRIC RANK
$91,347
HOUSEHOLDER INCOME AGES 45 - 64 YEARS
1.1/ 100
METRIC RATING
243rd/ 347
METRIC RANK
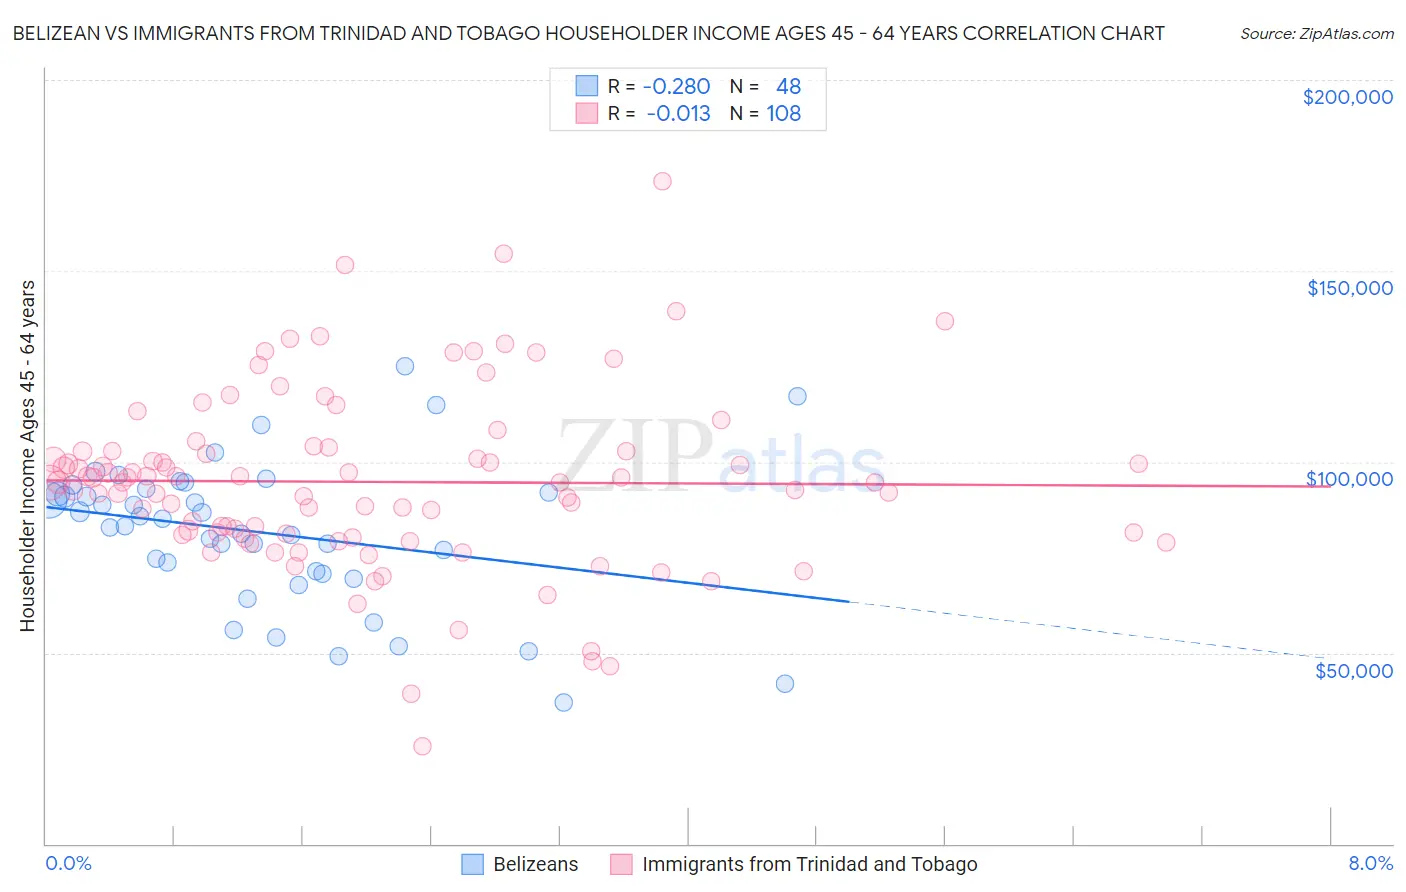
Belizean vs Immigrants from Trinidad and Tobago Householder Income Ages 45 - 64 years Correlation Chart
The statistical analysis conducted on geographies consisting of 144,082,540 people shows a weak negative correlation between the proportion of Belizeans and household income with householder between the ages 45 and 64 in the United States with a correlation coefficient (R) of -0.280 and weighted average of $88,684. Similarly, the statistical analysis conducted on geographies consisting of 223,374,327 people shows no correlation between the proportion of Immigrants from Trinidad and Tobago and household income with householder between the ages 45 and 64 in the United States with a correlation coefficient (R) of -0.013 and weighted average of $91,347, a difference of 3.0%.
Householder Income Ages 45 - 64 years Correlation Summary
| Measurement | Belizean | Immigrants from Trinidad and Tobago |
| Minimum | $37,000 | $25,417 |
| Maximum | $124,977 | $173,438 |
| Range | $87,977 | $148,021 |
| Mean | $81,502 | $94,766 |
| Median | $84,116 | $94,630 |
| Interquartile 25% (IQ1) | $70,959 | $80,933 |
| Interquartile 75% (IQ3) | $92,338 | $102,864 |
| Interquartile Range (IQR) | $21,379 | $21,931 |
| Standard Deviation (Sample) | $18,999 | $23,554 |
| Standard Deviation (Population) | $18,800 | $23,445 |
Demographics Similar to Belizeans and Immigrants from Trinidad and Tobago by Householder Income Ages 45 - 64 years
In terms of householder income ages 45 - 64 years, the demographic groups most similar to Belizeans are Somali ($88,600, a difference of 0.090%), Liberian ($88,929, a difference of 0.28%), Immigrants from Nicaragua ($89,108, a difference of 0.48%), Immigrants from Barbados ($89,394, a difference of 0.80%), and German Russian ($89,398, a difference of 0.81%). Similarly, the demographic groups most similar to Immigrants from Trinidad and Tobago are Inupiat ($91,355, a difference of 0.010%), Immigrants from Middle Africa ($91,293, a difference of 0.060%), Guyanese ($90,966, a difference of 0.42%), Central American ($90,951, a difference of 0.44%), and Alaskan Athabascan ($90,951, a difference of 0.44%).
| Demographics | Rating | Rank | Householder Income Ages 45 - 64 years |
| Inupiat | 1.1 /100 | #242 | Tragic $91,355 |
| Immigrants | Trinidad and Tobago | 1.1 /100 | #243 | Tragic $91,347 |
| Immigrants | Middle Africa | 1.1 /100 | #244 | Tragic $91,293 |
| Guyanese | 0.9 /100 | #245 | Tragic $90,966 |
| Central Americans | 0.9 /100 | #246 | Tragic $90,951 |
| Alaskan Athabascans | 0.9 /100 | #247 | Tragic $90,951 |
| Immigrants | Laos | 0.9 /100 | #248 | Tragic $90,909 |
| Mexican American Indians | 0.8 /100 | #249 | Tragic $90,811 |
| Sub-Saharan Africans | 0.8 /100 | #250 | Tragic $90,691 |
| Americans | 0.7 /100 | #251 | Tragic $90,536 |
| Marshallese | 0.7 /100 | #252 | Tragic $90,455 |
| Barbadians | 0.6 /100 | #253 | Tragic $90,266 |
| Immigrants | Guyana | 0.6 /100 | #254 | Tragic $90,186 |
| West Indians | 0.5 /100 | #255 | Tragic $89,906 |
| French American Indians | 0.5 /100 | #256 | Tragic $89,811 |
| German Russians | 0.4 /100 | #257 | Tragic $89,398 |
| Immigrants | Barbados | 0.4 /100 | #258 | Tragic $89,394 |
| Immigrants | Nicaragua | 0.4 /100 | #259 | Tragic $89,108 |
| Liberians | 0.3 /100 | #260 | Tragic $88,929 |
| Belizeans | 0.3 /100 | #261 | Tragic $88,684 |
| Somalis | 0.3 /100 | #262 | Tragic $88,600 |