Nicaraguan vs Immigrants from Trinidad and Tobago Householder Income Ages 45 - 64 years
COMPARE
Nicaraguan
Immigrants from Trinidad and Tobago
Householder Income Ages 45 - 64 years
Householder Income Ages 45 - 64 years Comparison
Nicaraguans
Immigrants from Trinidad and Tobago
$92,554
HOUSEHOLDER INCOME AGES 45 - 64 YEARS
2.0/ 100
METRIC RATING
235th/ 347
METRIC RANK
$91,347
HOUSEHOLDER INCOME AGES 45 - 64 YEARS
1.1/ 100
METRIC RATING
243rd/ 347
METRIC RANK
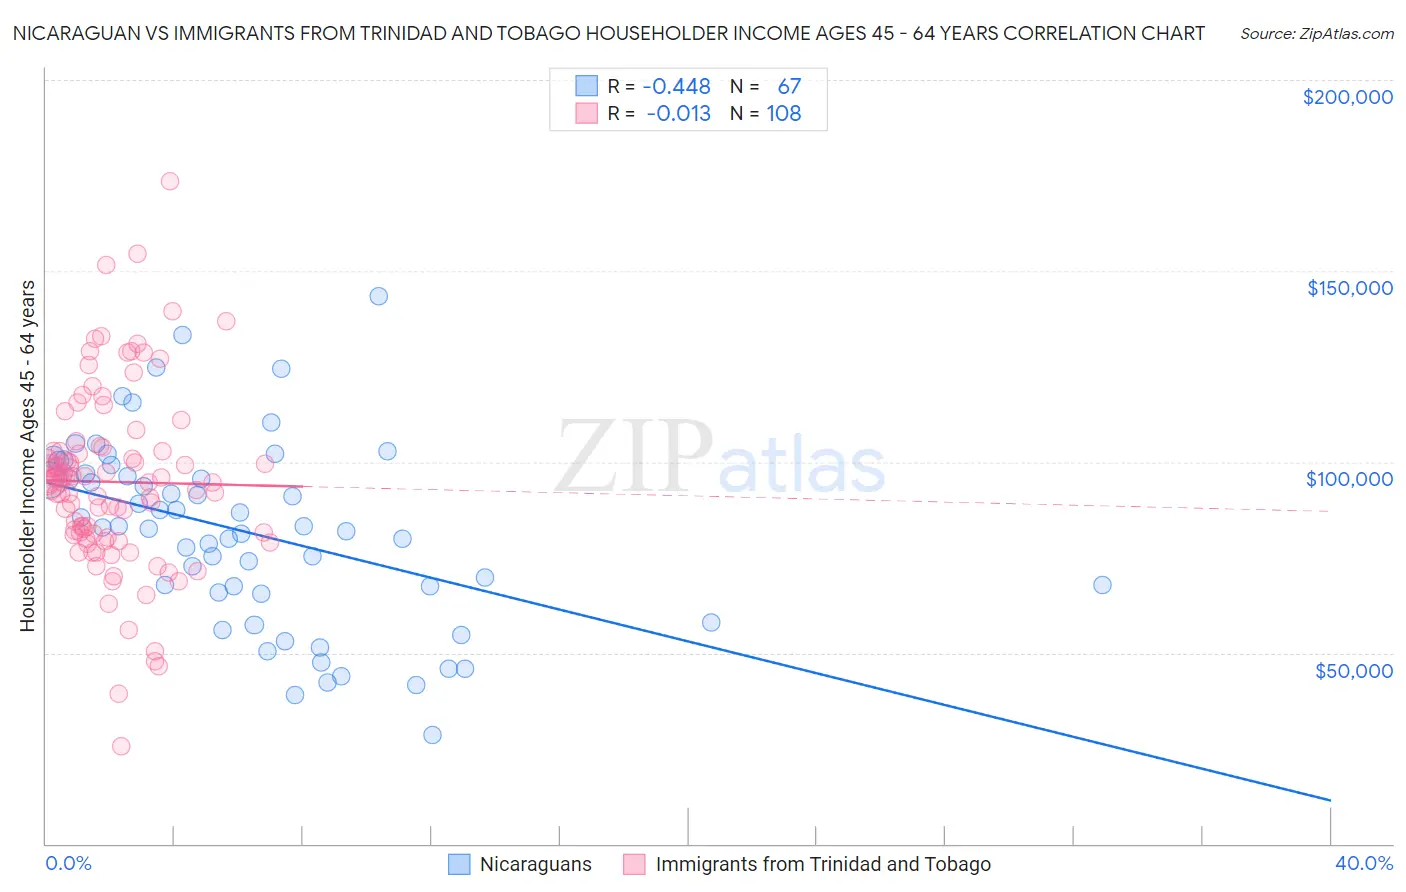
Nicaraguan vs Immigrants from Trinidad and Tobago Householder Income Ages 45 - 64 years Correlation Chart
The statistical analysis conducted on geographies consisting of 285,455,772 people shows a moderate negative correlation between the proportion of Nicaraguans and household income with householder between the ages 45 and 64 in the United States with a correlation coefficient (R) of -0.448 and weighted average of $92,554. Similarly, the statistical analysis conducted on geographies consisting of 223,374,327 people shows no correlation between the proportion of Immigrants from Trinidad and Tobago and household income with householder between the ages 45 and 64 in the United States with a correlation coefficient (R) of -0.013 and weighted average of $91,347, a difference of 1.3%.
Householder Income Ages 45 - 64 years Correlation Summary
| Measurement | Nicaraguan | Immigrants from Trinidad and Tobago |
| Minimum | $28,333 | $25,417 |
| Maximum | $143,278 | $173,438 |
| Range | $114,945 | $148,021 |
| Mean | $81,452 | $94,766 |
| Median | $82,750 | $94,630 |
| Interquartile 25% (IQ1) | $65,957 | $80,933 |
| Interquartile 75% (IQ3) | $97,029 | $102,864 |
| Interquartile Range (IQR) | $31,072 | $21,931 |
| Standard Deviation (Sample) | $24,263 | $23,554 |
| Standard Deviation (Population) | $24,082 | $23,445 |
Demographics Similar to Nicaraguans and Immigrants from Trinidad and Tobago by Householder Income Ages 45 - 64 years
In terms of householder income ages 45 - 64 years, the demographic groups most similar to Nicaraguans are Immigrants from Western Africa ($92,384, a difference of 0.18%), Immigrants from Bangladesh ($92,208, a difference of 0.37%), Pennsylvania German ($91,956, a difference of 0.65%), Immigrants from El Salvador ($93,176, a difference of 0.67%), and Nepalese ($93,355, a difference of 0.87%). Similarly, the demographic groups most similar to Immigrants from Trinidad and Tobago are Trinidadian and Tobagonian ($91,357, a difference of 0.010%), Inupiat ($91,355, a difference of 0.010%), Immigrants from Burma/Myanmar ($91,385, a difference of 0.040%), Immigrants from Middle Africa ($91,293, a difference of 0.060%), and Immigrants from Ecuador ($91,462, a difference of 0.13%).
| Demographics | Rating | Rank | Householder Income Ages 45 - 64 years |
| Vietnamese | 3.6 /100 | #229 | Tragic $93,788 |
| Immigrants | Sudan | 3.6 /100 | #230 | Tragic $93,781 |
| Ecuadorians | 3.6 /100 | #231 | Tragic $93,739 |
| Sudanese | 3.5 /100 | #232 | Tragic $93,718 |
| Nepalese | 3.0 /100 | #233 | Tragic $93,355 |
| Immigrants | El Salvador | 2.7 /100 | #234 | Tragic $93,176 |
| Nicaraguans | 2.0 /100 | #235 | Tragic $92,554 |
| Immigrants | Western Africa | 1.8 /100 | #236 | Tragic $92,384 |
| Immigrants | Bangladesh | 1.7 /100 | #237 | Tragic $92,208 |
| Pennsylvania Germans | 1.5 /100 | #238 | Tragic $91,956 |
| Immigrants | Ecuador | 1.2 /100 | #239 | Tragic $91,462 |
| Immigrants | Burma/Myanmar | 1.1 /100 | #240 | Tragic $91,385 |
| Trinidadians and Tobagonians | 1.1 /100 | #241 | Tragic $91,357 |
| Inupiat | 1.1 /100 | #242 | Tragic $91,355 |
| Immigrants | Trinidad and Tobago | 1.1 /100 | #243 | Tragic $91,347 |
| Immigrants | Middle Africa | 1.1 /100 | #244 | Tragic $91,293 |
| Guyanese | 0.9 /100 | #245 | Tragic $90,966 |
| Central Americans | 0.9 /100 | #246 | Tragic $90,951 |
| Alaskan Athabascans | 0.9 /100 | #247 | Tragic $90,951 |
| Immigrants | Laos | 0.9 /100 | #248 | Tragic $90,909 |
| Mexican American Indians | 0.8 /100 | #249 | Tragic $90,811 |