Samoan vs Immigrants from Northern Africa Householder Income Ages 45 - 64 years
COMPARE
Samoan
Immigrants from Northern Africa
Householder Income Ages 45 - 64 years
Householder Income Ages 45 - 64 years Comparison
Samoans
Immigrants from Northern Africa
$101,580
HOUSEHOLDER INCOME AGES 45 - 64 YEARS
65.3/ 100
METRIC RATING
166th/ 347
METRIC RANK
$105,430
HOUSEHOLDER INCOME AGES 45 - 64 YEARS
92.8/ 100
METRIC RATING
124th/ 347
METRIC RANK
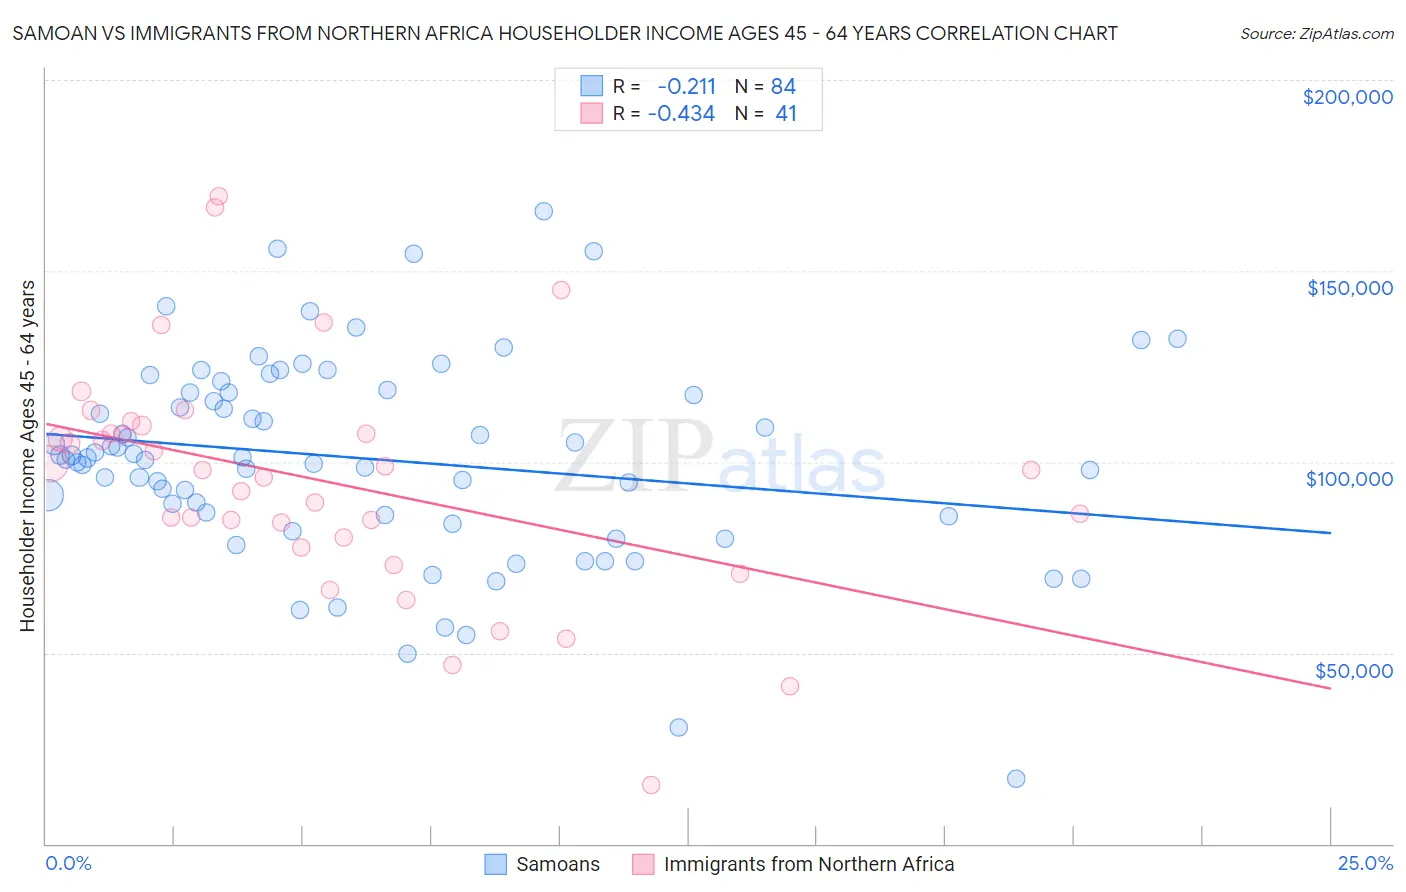
Samoan vs Immigrants from Northern Africa Householder Income Ages 45 - 64 years Correlation Chart
The statistical analysis conducted on geographies consisting of 224,959,731 people shows a weak negative correlation between the proportion of Samoans and household income with householder between the ages 45 and 64 in the United States with a correlation coefficient (R) of -0.211 and weighted average of $101,580. Similarly, the statistical analysis conducted on geographies consisting of 320,874,283 people shows a moderate negative correlation between the proportion of Immigrants from Northern Africa and household income with householder between the ages 45 and 64 in the United States with a correlation coefficient (R) of -0.434 and weighted average of $105,430, a difference of 3.8%.
Householder Income Ages 45 - 64 years Correlation Summary
| Measurement | Samoan | Immigrants from Northern Africa |
| Minimum | $16,995 | $15,339 |
| Maximum | $165,714 | $169,416 |
| Range | $148,719 | $154,077 |
| Mean | $100,718 | $94,832 |
| Median | $101,006 | $97,957 |
| Interquartile 25% (IQ1) | $85,977 | $78,949 |
| Interquartile 75% (IQ3) | $118,111 | $108,413 |
| Interquartile Range (IQR) | $32,135 | $29,464 |
| Standard Deviation (Sample) | $26,759 | $30,815 |
| Standard Deviation (Population) | $26,599 | $30,437 |
Similar Demographics by Householder Income Ages 45 - 64 years
Demographics Similar to Samoans by Householder Income Ages 45 - 64 years
In terms of householder income ages 45 - 64 years, the demographic groups most similar to Samoans are Czechoslovakian ($101,387, a difference of 0.19%), Immigrants from Albania ($101,957, a difference of 0.37%), South American Indian ($101,171, a difference of 0.40%), Guamanian/Chamorro ($101,170, a difference of 0.41%), and English ($102,021, a difference of 0.43%).
| Demographics | Rating | Rank | Householder Income Ages 45 - 64 years |
| Sierra Leoneans | 74.2 /100 | #159 | Good $102,427 |
| Icelanders | 72.5 /100 | #160 | Good $102,261 |
| Immigrants | Nepal | 71.8 /100 | #161 | Good $102,190 |
| Scottish | 71.1 /100 | #162 | Good $102,123 |
| English | 70.1 /100 | #163 | Good $102,021 |
| Immigrants | Morocco | 70.0 /100 | #164 | Good $102,015 |
| Immigrants | Albania | 69.4 /100 | #165 | Good $101,957 |
| Samoans | 65.3 /100 | #166 | Good $101,580 |
| Czechoslovakians | 63.0 /100 | #167 | Good $101,387 |
| South American Indians | 60.5 /100 | #168 | Good $101,171 |
| Guamanians/Chamorros | 60.5 /100 | #169 | Good $101,170 |
| Slovaks | 58.8 /100 | #170 | Average $101,029 |
| South Americans | 56.4 /100 | #171 | Average $100,837 |
| Immigrants | Uzbekistan | 52.5 /100 | #172 | Average $100,523 |
| Alsatians | 51.4 /100 | #173 | Average $100,435 |
Demographics Similar to Immigrants from Northern Africa by Householder Income Ages 45 - 64 years
In terms of householder income ages 45 - 64 years, the demographic groups most similar to Immigrants from Northern Africa are Pakistani ($105,317, a difference of 0.11%), Portuguese ($105,309, a difference of 0.12%), Immigrants from Saudi Arabia ($105,249, a difference of 0.17%), Danish ($105,619, a difference of 0.18%), and Native Hawaiian ($105,149, a difference of 0.27%).
| Demographics | Rating | Rank | Householder Income Ages 45 - 64 years |
| Albanians | 95.1 /100 | #117 | Exceptional $106,243 |
| Immigrants | Western Asia | 95.0 /100 | #118 | Exceptional $106,217 |
| Immigrants | Jordan | 94.9 /100 | #119 | Exceptional $106,164 |
| Immigrants | South Eastern Asia | 94.8 /100 | #120 | Exceptional $106,109 |
| Poles | 94.4 /100 | #121 | Exceptional $105,952 |
| Immigrants | North Macedonia | 94.2 /100 | #122 | Exceptional $105,892 |
| Danes | 93.4 /100 | #123 | Exceptional $105,619 |
| Immigrants | Northern Africa | 92.8 /100 | #124 | Exceptional $105,430 |
| Pakistanis | 92.4 /100 | #125 | Exceptional $105,317 |
| Portuguese | 92.4 /100 | #126 | Exceptional $105,309 |
| Immigrants | Saudi Arabia | 92.2 /100 | #127 | Exceptional $105,249 |
| Native Hawaiians | 91.8 /100 | #128 | Exceptional $105,149 |
| Peruvians | 91.5 /100 | #129 | Exceptional $105,070 |
| Immigrants | Zimbabwe | 91.2 /100 | #130 | Exceptional $104,992 |
| Immigrants | Syria | 90.7 /100 | #131 | Exceptional $104,858 |