Samoan vs Immigrants from Jamaica Householder Income Ages 45 - 64 years
COMPARE
Samoan
Immigrants from Jamaica
Householder Income Ages 45 - 64 years
Householder Income Ages 45 - 64 years Comparison
Samoans
Immigrants from Jamaica
$101,580
HOUSEHOLDER INCOME AGES 45 - 64 YEARS
65.3/ 100
METRIC RATING
166th/ 347
METRIC RANK
$87,035
HOUSEHOLDER INCOME AGES 45 - 64 YEARS
0.1/ 100
METRIC RATING
278th/ 347
METRIC RANK
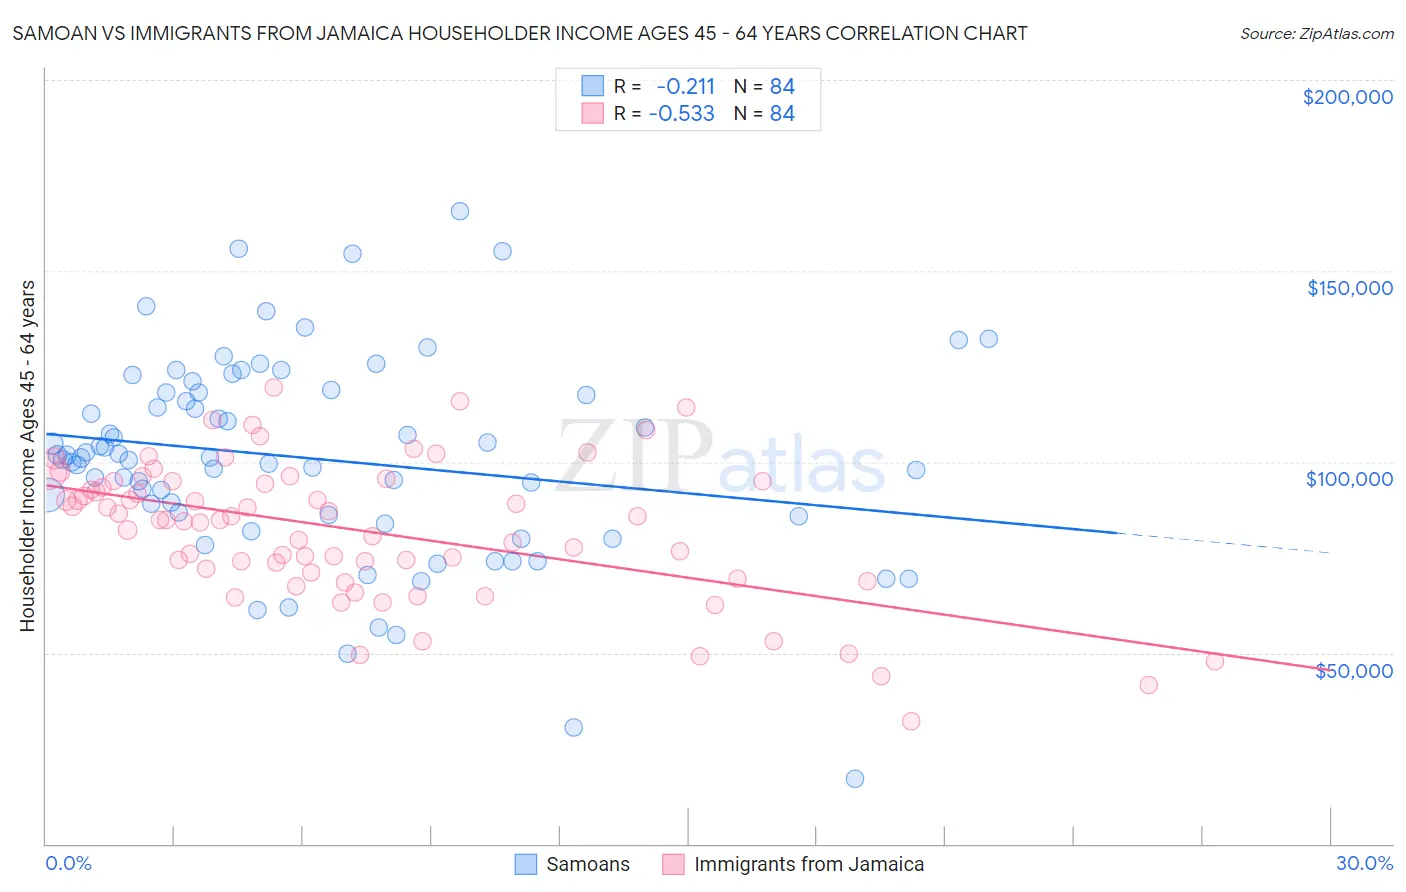
Samoan vs Immigrants from Jamaica Householder Income Ages 45 - 64 years Correlation Chart
The statistical analysis conducted on geographies consisting of 224,959,731 people shows a weak negative correlation between the proportion of Samoans and household income with householder between the ages 45 and 64 in the United States with a correlation coefficient (R) of -0.211 and weighted average of $101,580. Similarly, the statistical analysis conducted on geographies consisting of 301,245,641 people shows a substantial negative correlation between the proportion of Immigrants from Jamaica and household income with householder between the ages 45 and 64 in the United States with a correlation coefficient (R) of -0.533 and weighted average of $87,035, a difference of 16.7%.
Householder Income Ages 45 - 64 years Correlation Summary
| Measurement | Samoan | Immigrants from Jamaica |
| Minimum | $16,995 | $31,923 |
| Maximum | $165,714 | $119,503 |
| Range | $148,719 | $87,580 |
| Mean | $100,718 | $82,100 |
| Median | $101,006 | $84,769 |
| Interquartile 25% (IQ1) | $85,977 | $71,502 |
| Interquartile 75% (IQ3) | $118,111 | $94,805 |
| Interquartile Range (IQR) | $32,135 | $23,303 |
| Standard Deviation (Sample) | $26,759 | $18,162 |
| Standard Deviation (Population) | $26,599 | $18,054 |
Similar Demographics by Householder Income Ages 45 - 64 years
Demographics Similar to Samoans by Householder Income Ages 45 - 64 years
In terms of householder income ages 45 - 64 years, the demographic groups most similar to Samoans are Czechoslovakian ($101,387, a difference of 0.19%), Immigrants from Albania ($101,957, a difference of 0.37%), South American Indian ($101,171, a difference of 0.40%), Guamanian/Chamorro ($101,170, a difference of 0.41%), and English ($102,021, a difference of 0.43%).
| Demographics | Rating | Rank | Householder Income Ages 45 - 64 years |
| Sierra Leoneans | 74.2 /100 | #159 | Good $102,427 |
| Icelanders | 72.5 /100 | #160 | Good $102,261 |
| Immigrants | Nepal | 71.8 /100 | #161 | Good $102,190 |
| Scottish | 71.1 /100 | #162 | Good $102,123 |
| English | 70.1 /100 | #163 | Good $102,021 |
| Immigrants | Morocco | 70.0 /100 | #164 | Good $102,015 |
| Immigrants | Albania | 69.4 /100 | #165 | Good $101,957 |
| Samoans | 65.3 /100 | #166 | Good $101,580 |
| Czechoslovakians | 63.0 /100 | #167 | Good $101,387 |
| South American Indians | 60.5 /100 | #168 | Good $101,171 |
| Guamanians/Chamorros | 60.5 /100 | #169 | Good $101,170 |
| Slovaks | 58.8 /100 | #170 | Average $101,029 |
| South Americans | 56.4 /100 | #171 | Average $100,837 |
| Immigrants | Uzbekistan | 52.5 /100 | #172 | Average $100,523 |
| Alsatians | 51.4 /100 | #173 | Average $100,435 |
Demographics Similar to Immigrants from Jamaica by Householder Income Ages 45 - 64 years
In terms of householder income ages 45 - 64 years, the demographic groups most similar to Immigrants from Jamaica are Yakama ($86,992, a difference of 0.050%), Immigrants from Somalia ($86,987, a difference of 0.050%), Yaqui ($86,914, a difference of 0.14%), Senegalese ($86,897, a difference of 0.16%), and Cree ($87,185, a difference of 0.17%).
| Demographics | Rating | Rank | Householder Income Ages 45 - 64 years |
| Guatemalans | 0.2 /100 | #271 | Tragic $87,705 |
| Cape Verdeans | 0.2 /100 | #272 | Tragic $87,580 |
| Spanish American Indians | 0.2 /100 | #273 | Tragic $87,561 |
| Iroquois | 0.1 /100 | #274 | Tragic $87,255 |
| Immigrants | Belize | 0.1 /100 | #275 | Tragic $87,229 |
| Immigrants | Latin America | 0.1 /100 | #276 | Tragic $87,219 |
| Cree | 0.1 /100 | #277 | Tragic $87,185 |
| Immigrants | Jamaica | 0.1 /100 | #278 | Tragic $87,035 |
| Yakama | 0.1 /100 | #279 | Tragic $86,992 |
| Immigrants | Somalia | 0.1 /100 | #280 | Tragic $86,987 |
| Yaqui | 0.1 /100 | #281 | Tragic $86,914 |
| Senegalese | 0.1 /100 | #282 | Tragic $86,897 |
| Mexicans | 0.1 /100 | #283 | Tragic $86,816 |
| Central American Indians | 0.1 /100 | #284 | Tragic $86,764 |
| Blackfeet | 0.1 /100 | #285 | Tragic $86,595 |