Immigrants from Croatia vs Immigrants from Trinidad and Tobago Householder Income Ages 45 - 64 years
COMPARE
Immigrants from Croatia
Immigrants from Trinidad and Tobago
Householder Income Ages 45 - 64 years
Householder Income Ages 45 - 64 years Comparison
Immigrants from Croatia
Immigrants from Trinidad and Tobago
$108,304
HOUSEHOLDER INCOME AGES 45 - 64 YEARS
98.2/ 100
METRIC RATING
93rd/ 347
METRIC RANK
$91,347
HOUSEHOLDER INCOME AGES 45 - 64 YEARS
1.1/ 100
METRIC RATING
243rd/ 347
METRIC RANK
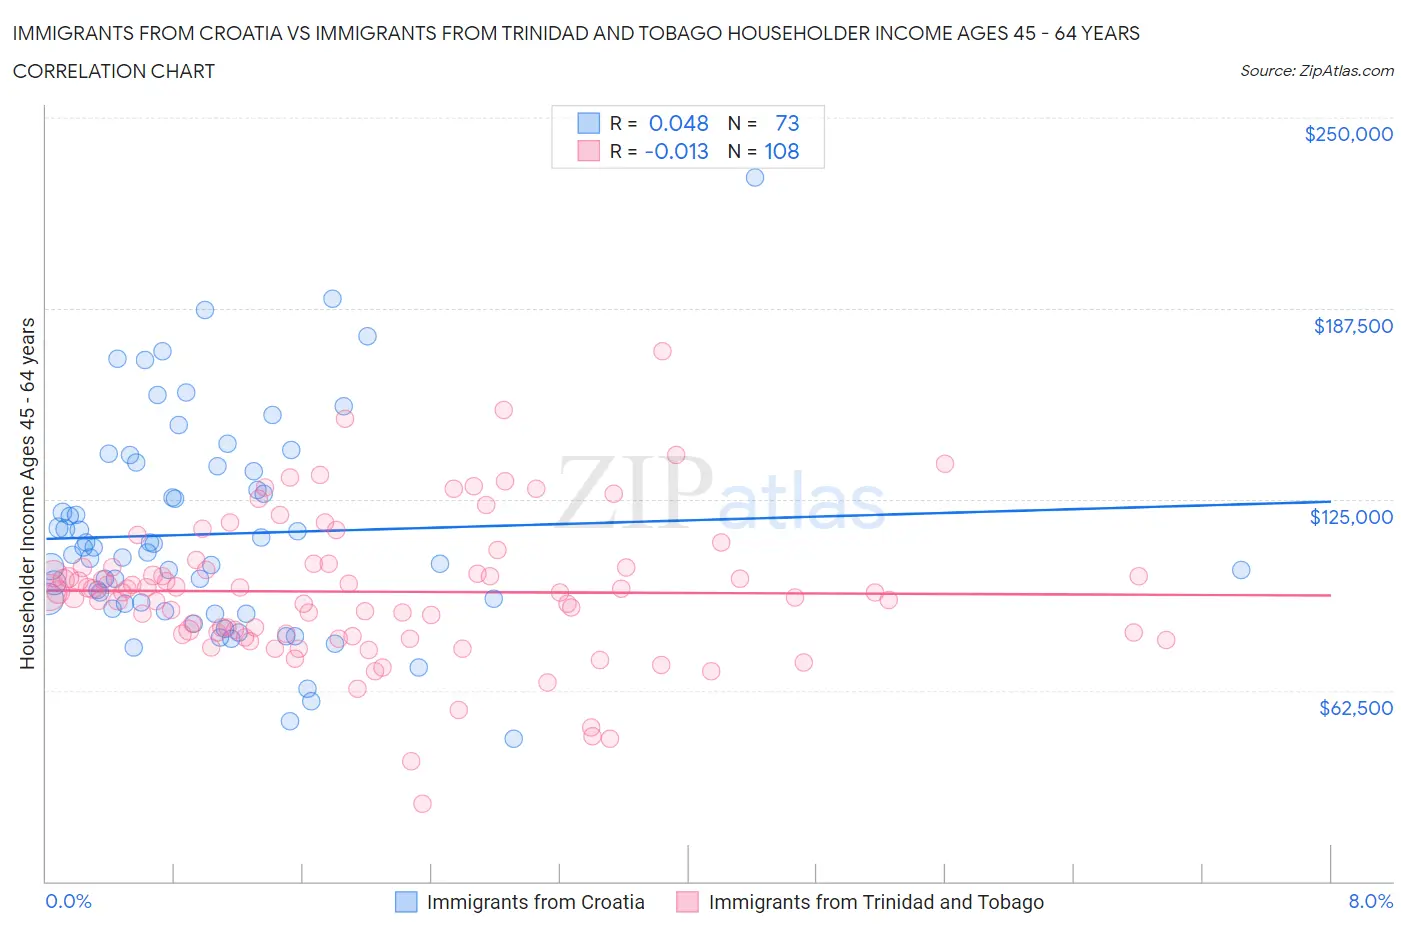
Immigrants from Croatia vs Immigrants from Trinidad and Tobago Householder Income Ages 45 - 64 years Correlation Chart
The statistical analysis conducted on geographies consisting of 132,538,212 people shows no correlation between the proportion of Immigrants from Croatia and household income with householder between the ages 45 and 64 in the United States with a correlation coefficient (R) of 0.048 and weighted average of $108,304. Similarly, the statistical analysis conducted on geographies consisting of 223,374,327 people shows no correlation between the proportion of Immigrants from Trinidad and Tobago and household income with householder between the ages 45 and 64 in the United States with a correlation coefficient (R) of -0.013 and weighted average of $91,347, a difference of 18.6%.
Householder Income Ages 45 - 64 years Correlation Summary
| Measurement | Immigrants from Croatia | Immigrants from Trinidad and Tobago |
| Minimum | $46,667 | $25,417 |
| Maximum | $230,494 | $173,438 |
| Range | $183,827 | $148,021 |
| Mean | $113,652 | $94,766 |
| Median | $107,692 | $94,630 |
| Interquartile 25% (IQ1) | $89,990 | $80,933 |
| Interquartile 75% (IQ3) | $135,056 | $102,864 |
| Interquartile Range (IQR) | $45,066 | $21,931 |
| Standard Deviation (Sample) | $34,547 | $23,554 |
| Standard Deviation (Population) | $34,310 | $23,445 |
Similar Demographics by Householder Income Ages 45 - 64 years
Demographics Similar to Immigrants from Croatia by Householder Income Ages 45 - 64 years
In terms of householder income ages 45 - 64 years, the demographic groups most similar to Immigrants from Croatia are Sri Lankan ($108,270, a difference of 0.030%), Immigrants from Hungary ($108,267, a difference of 0.030%), Immigrants from Argentina ($108,264, a difference of 0.040%), Croatian ($108,383, a difference of 0.070%), and Immigrants from Philippines ($108,471, a difference of 0.15%).
| Demographics | Rating | Rank | Householder Income Ages 45 - 64 years |
| Austrians | 98.5 /100 | #86 | Exceptional $108,692 |
| Tongans | 98.5 /100 | #87 | Exceptional $108,643 |
| Romanians | 98.5 /100 | #88 | Exceptional $108,609 |
| Ukrainians | 98.3 /100 | #89 | Exceptional $108,475 |
| Immigrants | Philippines | 98.3 /100 | #90 | Exceptional $108,471 |
| Immigrants | Lebanon | 98.3 /100 | #91 | Exceptional $108,471 |
| Croatians | 98.3 /100 | #92 | Exceptional $108,383 |
| Immigrants | Croatia | 98.2 /100 | #93 | Exceptional $108,304 |
| Sri Lankans | 98.2 /100 | #94 | Exceptional $108,270 |
| Immigrants | Hungary | 98.2 /100 | #95 | Exceptional $108,267 |
| Immigrants | Argentina | 98.2 /100 | #96 | Exceptional $108,264 |
| Northern Europeans | 97.8 /100 | #97 | Exceptional $107,870 |
| Immigrants | Southern Europe | 97.7 /100 | #98 | Exceptional $107,775 |
| Palestinians | 97.6 /100 | #99 | Exceptional $107,721 |
| Immigrants | Serbia | 97.4 /100 | #100 | Exceptional $107,569 |
Demographics Similar to Immigrants from Trinidad and Tobago by Householder Income Ages 45 - 64 years
In terms of householder income ages 45 - 64 years, the demographic groups most similar to Immigrants from Trinidad and Tobago are Trinidadian and Tobagonian ($91,357, a difference of 0.010%), Inupiat ($91,355, a difference of 0.010%), Immigrants from Burma/Myanmar ($91,385, a difference of 0.040%), Immigrants from Middle Africa ($91,293, a difference of 0.060%), and Immigrants from Ecuador ($91,462, a difference of 0.13%).
| Demographics | Rating | Rank | Householder Income Ages 45 - 64 years |
| Immigrants | Western Africa | 1.8 /100 | #236 | Tragic $92,384 |
| Immigrants | Bangladesh | 1.7 /100 | #237 | Tragic $92,208 |
| Pennsylvania Germans | 1.5 /100 | #238 | Tragic $91,956 |
| Immigrants | Ecuador | 1.2 /100 | #239 | Tragic $91,462 |
| Immigrants | Burma/Myanmar | 1.1 /100 | #240 | Tragic $91,385 |
| Trinidadians and Tobagonians | 1.1 /100 | #241 | Tragic $91,357 |
| Inupiat | 1.1 /100 | #242 | Tragic $91,355 |
| Immigrants | Trinidad and Tobago | 1.1 /100 | #243 | Tragic $91,347 |
| Immigrants | Middle Africa | 1.1 /100 | #244 | Tragic $91,293 |
| Guyanese | 0.9 /100 | #245 | Tragic $90,966 |
| Central Americans | 0.9 /100 | #246 | Tragic $90,951 |
| Alaskan Athabascans | 0.9 /100 | #247 | Tragic $90,951 |
| Immigrants | Laos | 0.9 /100 | #248 | Tragic $90,909 |
| Mexican American Indians | 0.8 /100 | #249 | Tragic $90,811 |
| Sub-Saharan Africans | 0.8 /100 | #250 | Tragic $90,691 |