Russian vs Alsatian Median Male Earnings
COMPARE
Russian
Alsatian
Median Male Earnings
Median Male Earnings Comparison
Russians
Alsatians
$63,939
MEDIAN MALE EARNINGS
100.0/ 100
METRIC RATING
28th/ 347
METRIC RANK
$55,380
MEDIAN MALE EARNINGS
70.5/ 100
METRIC RATING
159th/ 347
METRIC RANK
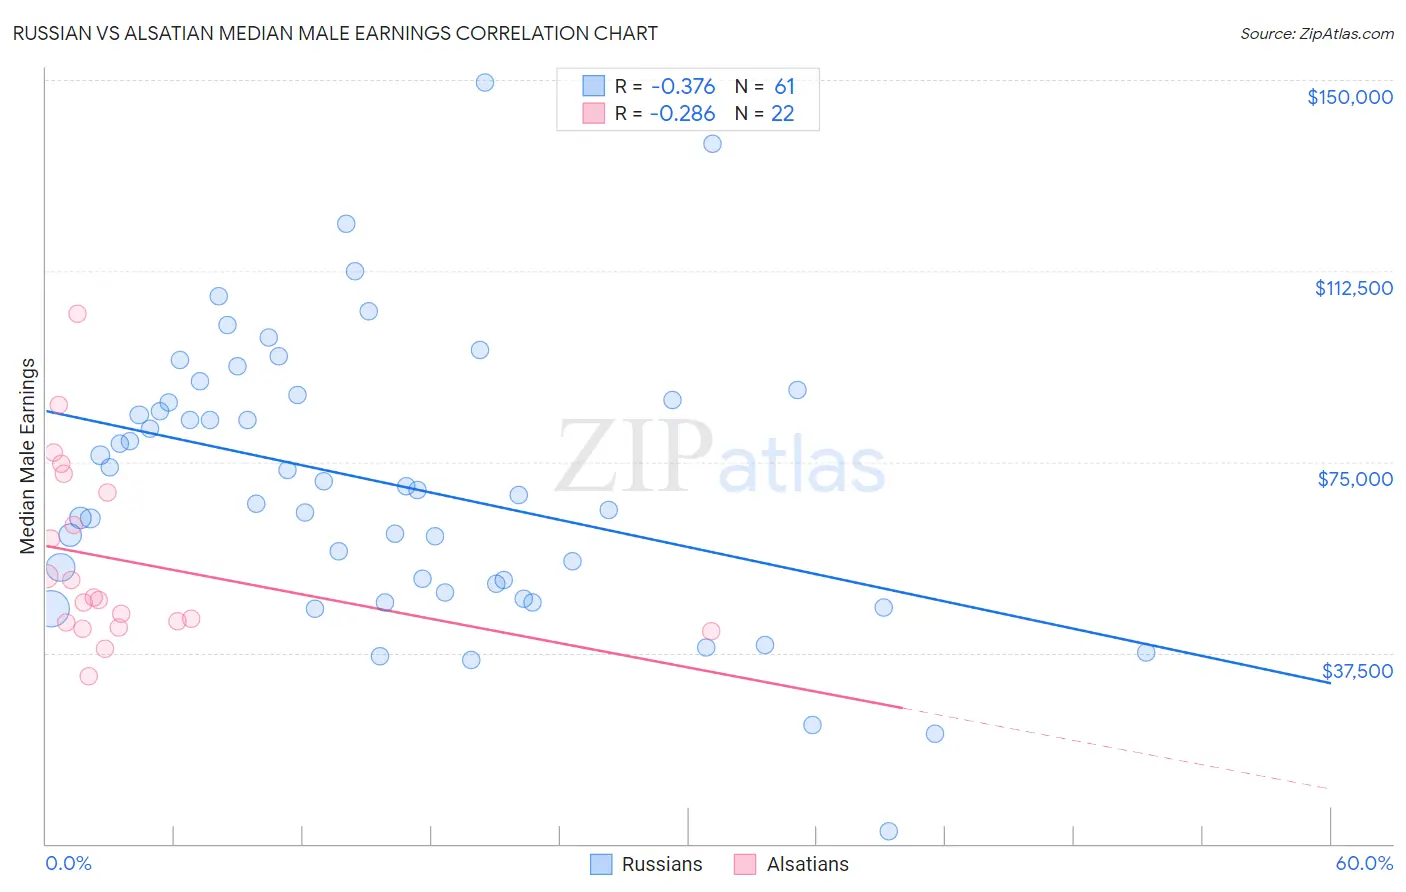
Russian vs Alsatian Median Male Earnings Correlation Chart
The statistical analysis conducted on geographies consisting of 511,765,575 people shows a mild negative correlation between the proportion of Russians and median male earnings in the United States with a correlation coefficient (R) of -0.376 and weighted average of $63,939. Similarly, the statistical analysis conducted on geographies consisting of 82,669,141 people shows a weak negative correlation between the proportion of Alsatians and median male earnings in the United States with a correlation coefficient (R) of -0.286 and weighted average of $55,380, a difference of 15.4%.
Median Male Earnings Correlation Summary
| Measurement | Russian | Alsatian |
| Minimum | $2,499 | $33,005 |
| Maximum | $149,573 | $104,004 |
| Range | $147,074 | $70,999 |
| Mean | $70,744 | $55,815 |
| Median | $69,557 | $48,104 |
| Interquartile 25% (IQ1) | $50,291 | $43,478 |
| Interquartile 75% (IQ3) | $87,600 | $69,063 |
| Interquartile Range (IQR) | $37,309 | $25,585 |
| Standard Deviation (Sample) | $27,498 | $17,889 |
| Standard Deviation (Population) | $27,272 | $17,478 |
Similar Demographics by Median Male Earnings
Demographics Similar to Russians by Median Male Earnings
In terms of median male earnings, the demographic groups most similar to Russians are Immigrants from Switzerland ($63,944, a difference of 0.010%), Asian ($63,827, a difference of 0.17%), Immigrants from France ($63,715, a difference of 0.35%), Turkish ($64,253, a difference of 0.49%), and Latvian ($63,498, a difference of 0.69%).
| Demographics | Rating | Rank | Median Male Earnings |
| Immigrants | Sweden | 100.0 /100 | #21 | Exceptional $65,406 |
| Burmese | 100.0 /100 | #22 | Exceptional $65,236 |
| Immigrants | Korea | 100.0 /100 | #23 | Exceptional $65,079 |
| Immigrants | Northern Europe | 100.0 /100 | #24 | Exceptional $64,987 |
| Immigrants | Denmark | 100.0 /100 | #25 | Exceptional $64,625 |
| Turks | 100.0 /100 | #26 | Exceptional $64,253 |
| Immigrants | Switzerland | 100.0 /100 | #27 | Exceptional $63,944 |
| Russians | 100.0 /100 | #28 | Exceptional $63,939 |
| Asians | 100.0 /100 | #29 | Exceptional $63,827 |
| Immigrants | France | 100.0 /100 | #30 | Exceptional $63,715 |
| Latvians | 100.0 /100 | #31 | Exceptional $63,498 |
| Soviet Union | 100.0 /100 | #32 | Exceptional $63,382 |
| Immigrants | Lithuania | 100.0 /100 | #33 | Exceptional $63,346 |
| Immigrants | Russia | 100.0 /100 | #34 | Exceptional $63,326 |
| Immigrants | Asia | 100.0 /100 | #35 | Exceptional $63,240 |
Demographics Similar to Alsatians by Median Male Earnings
In terms of median male earnings, the demographic groups most similar to Alsatians are Czechoslovakian ($55,382, a difference of 0.0%), Basque ($55,370, a difference of 0.020%), Belgian ($55,361, a difference of 0.030%), French ($55,350, a difference of 0.050%), and Icelander ($55,415, a difference of 0.060%).
| Demographics | Rating | Rank | Median Male Earnings |
| Peruvians | 75.8 /100 | #152 | Good $55,659 |
| Immigrants | Nepal | 75.0 /100 | #153 | Good $55,615 |
| Taiwanese | 73.9 /100 | #154 | Good $55,556 |
| Scandinavians | 73.4 /100 | #155 | Good $55,527 |
| Immigrants | Ethiopia | 71.6 /100 | #156 | Good $55,434 |
| Icelanders | 71.2 /100 | #157 | Good $55,415 |
| Czechoslovakians | 70.5 /100 | #158 | Good $55,382 |
| Alsatians | 70.5 /100 | #159 | Good $55,380 |
| Basques | 70.3 /100 | #160 | Good $55,370 |
| Belgians | 70.1 /100 | #161 | Good $55,361 |
| French | 69.9 /100 | #162 | Good $55,350 |
| Ugandans | 68.6 /100 | #163 | Good $55,290 |
| Immigrants | South Eastern Asia | 67.6 /100 | #164 | Good $55,241 |
| Immigrants | Portugal | 66.3 /100 | #165 | Good $55,182 |
| Germans | 61.6 /100 | #166 | Good $54,974 |