Russian vs Immigrants from Iran Median Male Earnings
COMPARE
Russian
Immigrants from Iran
Median Male Earnings
Median Male Earnings Comparison
Russians
Immigrants from Iran
$63,939
MEDIAN MALE EARNINGS
100.0/ 100
METRIC RATING
28th/ 347
METRIC RANK
$69,284
MEDIAN MALE EARNINGS
100.0/ 100
METRIC RATING
8th/ 347
METRIC RANK
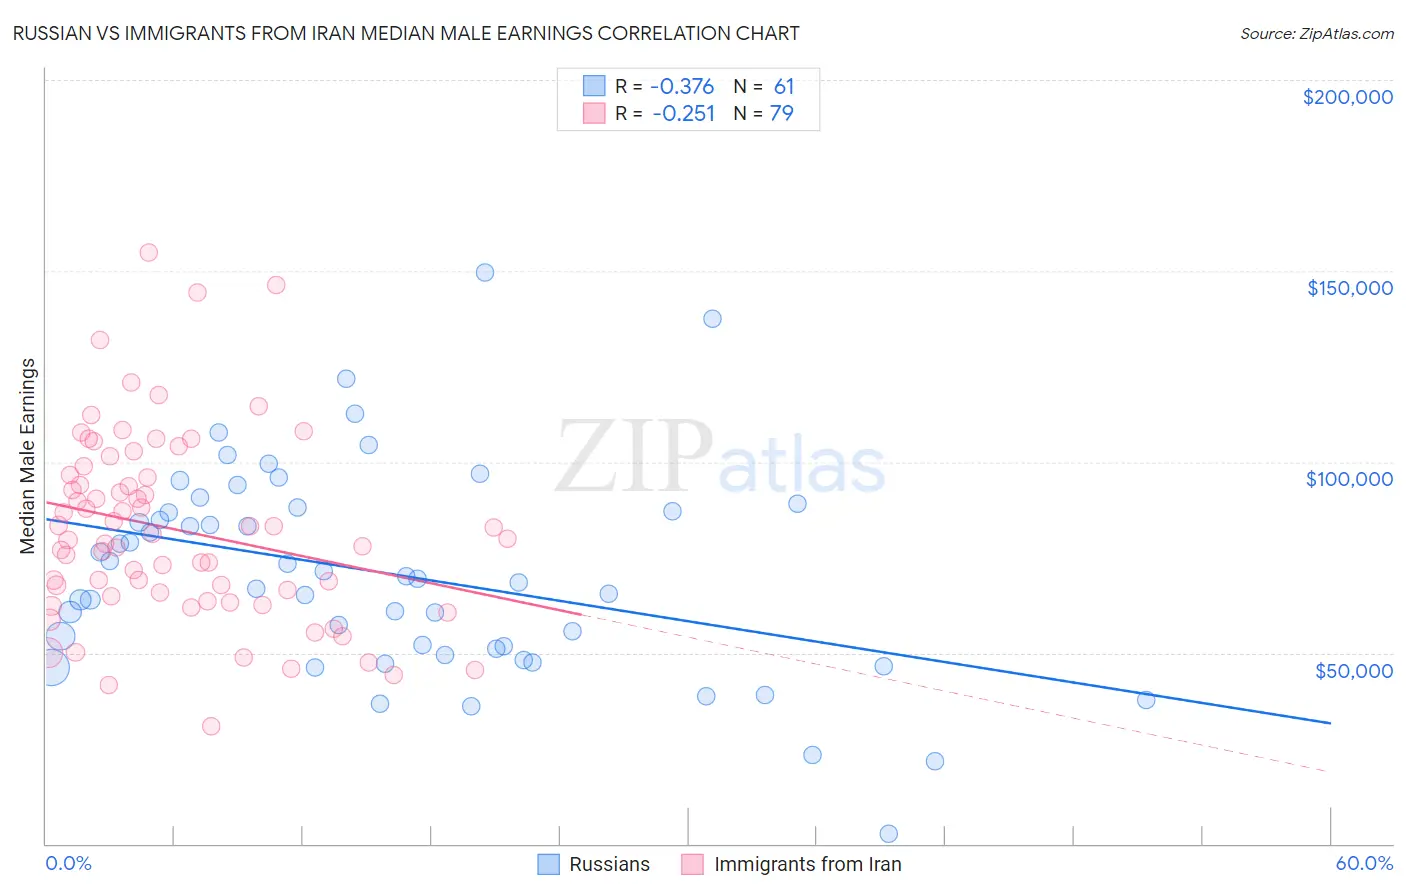
Russian vs Immigrants from Iran Median Male Earnings Correlation Chart
The statistical analysis conducted on geographies consisting of 511,765,575 people shows a mild negative correlation between the proportion of Russians and median male earnings in the United States with a correlation coefficient (R) of -0.376 and weighted average of $63,939. Similarly, the statistical analysis conducted on geographies consisting of 279,819,877 people shows a weak negative correlation between the proportion of Immigrants from Iran and median male earnings in the United States with a correlation coefficient (R) of -0.251 and weighted average of $69,284, a difference of 8.4%.
Median Male Earnings Correlation Summary
| Measurement | Russian | Immigrants from Iran |
| Minimum | $2,499 | $30,816 |
| Maximum | $149,573 | $154,782 |
| Range | $147,074 | $123,966 |
| Mean | $70,744 | $82,249 |
| Median | $69,557 | $79,904 |
| Interquartile 25% (IQ1) | $50,291 | $64,663 |
| Interquartile 75% (IQ3) | $87,600 | $96,638 |
| Interquartile Range (IQR) | $37,309 | $31,975 |
| Standard Deviation (Sample) | $27,498 | $24,742 |
| Standard Deviation (Population) | $27,272 | $24,585 |
Demographics Similar to Russians and Immigrants from Iran by Median Male Earnings
In terms of median male earnings, the demographic groups most similar to Russians are Immigrants from Switzerland ($63,944, a difference of 0.010%), Turkish ($64,253, a difference of 0.49%), Immigrants from Denmark ($64,625, a difference of 1.1%), Immigrants from Northern Europe ($64,987, a difference of 1.6%), and Immigrants from Korea ($65,079, a difference of 1.8%). Similarly, the demographic groups most similar to Immigrants from Iran are Immigrants from South Central Asia ($68,960, a difference of 0.47%), Immigrants from Israel ($68,716, a difference of 0.83%), Immigrants from Ireland ($67,698, a difference of 2.3%), Immigrants from Australia ($67,634, a difference of 2.4%), and Immigrants from China ($67,353, a difference of 2.9%).
| Demographics | Rating | Rank | Median Male Earnings |
| Immigrants | Iran | 100.0 /100 | #8 | Exceptional $69,284 |
| Immigrants | South Central Asia | 100.0 /100 | #9 | Exceptional $68,960 |
| Immigrants | Israel | 100.0 /100 | #10 | Exceptional $68,716 |
| Immigrants | Ireland | 100.0 /100 | #11 | Exceptional $67,698 |
| Immigrants | Australia | 100.0 /100 | #12 | Exceptional $67,634 |
| Immigrants | China | 100.0 /100 | #13 | Exceptional $67,353 |
| Okinawans | 100.0 /100 | #14 | Exceptional $67,232 |
| Immigrants | Eastern Asia | 100.0 /100 | #15 | Exceptional $66,903 |
| Eastern Europeans | 100.0 /100 | #16 | Exceptional $66,472 |
| Immigrants | Belgium | 100.0 /100 | #17 | Exceptional $66,125 |
| Indians (Asian) | 100.0 /100 | #18 | Exceptional $66,078 |
| Cypriots | 100.0 /100 | #19 | Exceptional $65,549 |
| Immigrants | Japan | 100.0 /100 | #20 | Exceptional $65,518 |
| Immigrants | Sweden | 100.0 /100 | #21 | Exceptional $65,406 |
| Burmese | 100.0 /100 | #22 | Exceptional $65,236 |
| Immigrants | Korea | 100.0 /100 | #23 | Exceptional $65,079 |
| Immigrants | Northern Europe | 100.0 /100 | #24 | Exceptional $64,987 |
| Immigrants | Denmark | 100.0 /100 | #25 | Exceptional $64,625 |
| Turks | 100.0 /100 | #26 | Exceptional $64,253 |
| Immigrants | Switzerland | 100.0 /100 | #27 | Exceptional $63,944 |
| Russians | 100.0 /100 | #28 | Exceptional $63,939 |